Fig. 6
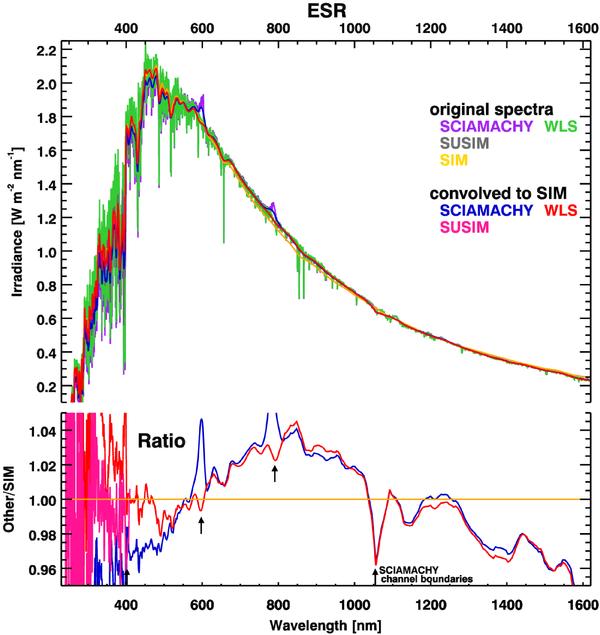
SCIAMACHY with (red) and without (blue) WLS corrections, SUSIM (pink) and SIM (tan) at their native spectral resolution and after convolving using SIM’s ESR instrument function (top subpanel). Bottom subpanel: solar ratios with respect to SIM after convolution. Mean ratio of UV-vis-IR spectra to SIM data is given in second and third columns of Table 3.
Current usage metrics show cumulative count of Article Views (full-text article views including HTML views, PDF and ePub downloads, according to the available data) and Abstracts Views on Vision4Press platform.
Data correspond to usage on the plateform after 2015. The current usage metrics is available 48-96 hours after online publication and is updated daily on week days.
Initial download of the metrics may take a while.