Fig. 2
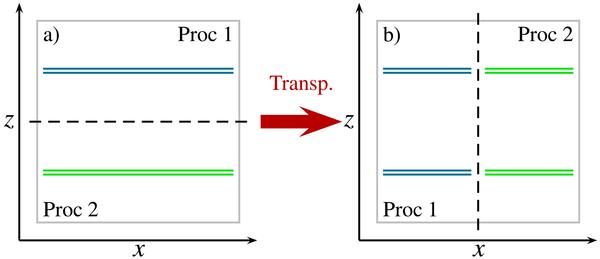
Sketch of the parallelisation of the ADI scheme. a) the initial domain decomposition of the Pencil Code for a 2-D domain in the (x, z) plane. The coloured lines denote the data owned by the first processor (blue lines) and by the second one (green lines); b) the domain decomposition after the transposition needed to use the ADI solver.
Current usage metrics show cumulative count of Article Views (full-text article views including HTML views, PDF and ePub downloads, according to the available data) and Abstracts Views on Vision4Press platform.
Data correspond to usage on the plateform after 2015. The current usage metrics is available 48-96 hours after online publication and is updated daily on week days.
Initial download of the metrics may take a while.