Fig. 1
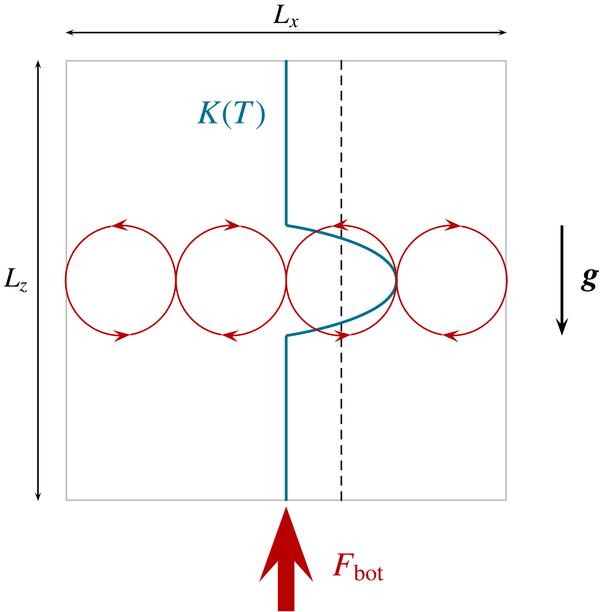
Sketch of our convective model. The blue curve corresponds to the radiative conductivity profile, the dashed line is the Schwarzschild criterion given in Eq. (6), and the large red arrow represents the radiative flux Fbot that is imposed at the bottom. The red rolls correspond to the convective motions that develop in the layer middle.
Current usage metrics show cumulative count of Article Views (full-text article views including HTML views, PDF and ePub downloads, according to the available data) and Abstracts Views on Vision4Press platform.
Data correspond to usage on the plateform after 2015. The current usage metrics is available 48-96 hours after online publication and is updated daily on week days.
Initial download of the metrics may take a while.