Fig. 8
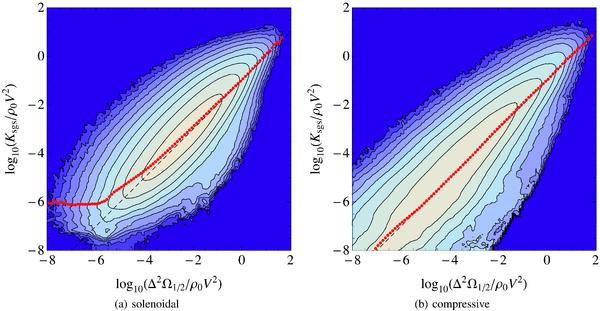
Correlation diagrams of the SGS turbulence energy vs. the denstrophy, normalized by the cutoff scale Δ, for 5123 LES with solenoidal and compressive forcing. The contours are logarithmic. The average relation between both quantities is indicated by the dotted lines, and the dashed line shows the relation Ksgs ~ 0.1Δ2Ω1/2.
Current usage metrics show cumulative count of Article Views (full-text article views including HTML views, PDF and ePub downloads, according to the available data) and Abstracts Views on Vision4Press platform.
Data correspond to usage on the plateform after 2015. The current usage metrics is available 48-96 hours after online publication and is updated daily on week days.
Initial download of the metrics may take a while.