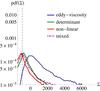
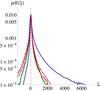
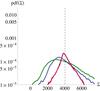
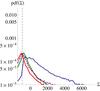
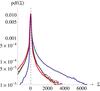
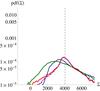
Fig. 3
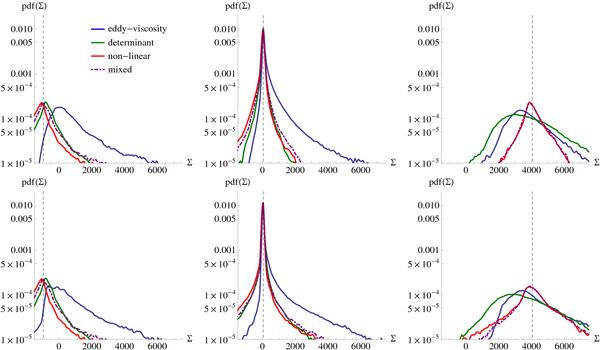
Slices of the two-dimensional probability density functions plotted in Figs. 1 and 2, showing the predictions of different closures for the values of the explicitly computed energy flux Σ32Δ that are indicated by the vertical dashed lines. The top and bottom rows of panels show the results for solenoidal and compressive forcing, respectively.
Current usage metrics show cumulative count of Article Views (full-text article views including HTML views, PDF and ePub downloads, according to the available data) and Abstracts Views on Vision4Press platform.
Data correspond to usage on the plateform after 2015. The current usage metrics is available 48-96 hours after online publication and is updated daily on week days.
Initial download of the metrics may take a while.