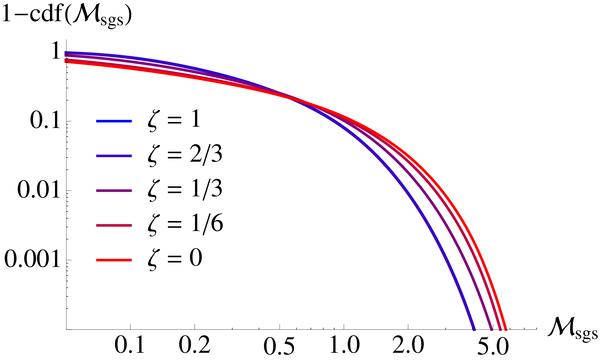
Fig. 14
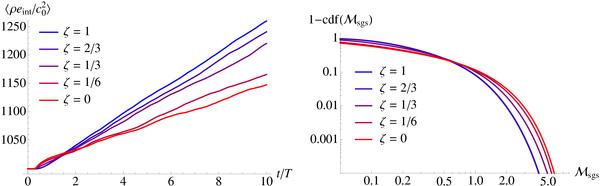
Left panel: time evolution of the mean internal energy for forcing with varying ζ and about the same rms Mach number. Right panel: volume fractions of zones, in which the SGS turbulence Mach number is greater than any given value for the same forcing parameters as in the left panel (the curves for ζ = 1 and ζ = 2/3 almost coincide).

Current usage metrics show cumulative count of Article Views (full-text article views including HTML views, PDF and ePub downloads, according to the available data) and Abstracts Views on Vision4Press platform.
Data correspond to usage on the plateform after 2015. The current usage metrics is available 48-96 hours after online publication and is updated daily on week days.
Initial download of the metrics may take a while.