Free Access
Fig. A.1
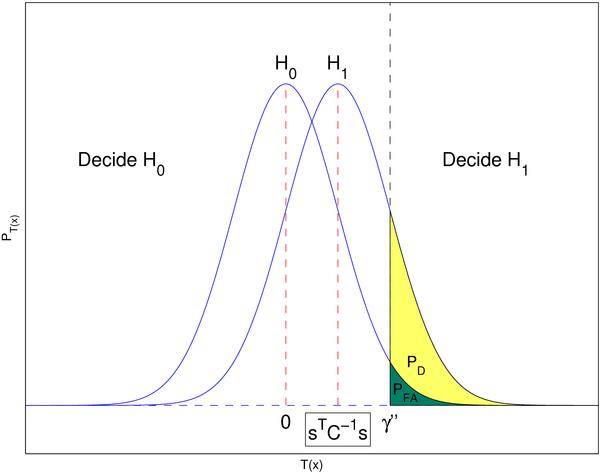
Probability density function of the statistic T(x) under the hypothesis ℋ0 (noise-only hypothesis) and ℋ1 (signal-present hypothesis). The detection-threshold is given by γ′′. The probability of false alarm (PFA) and the probability of detection (PD) are shown in green and yellow colors, respectively.
Current usage metrics show cumulative count of Article Views (full-text article views including HTML views, PDF and ePub downloads, according to the available data) and Abstracts Views on Vision4Press platform.
Data correspond to usage on the plateform after 2015. The current usage metrics is available 48-96 hours after online publication and is updated daily on week days.
Initial download of the metrics may take a while.