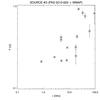
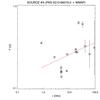
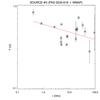
Fig. 7
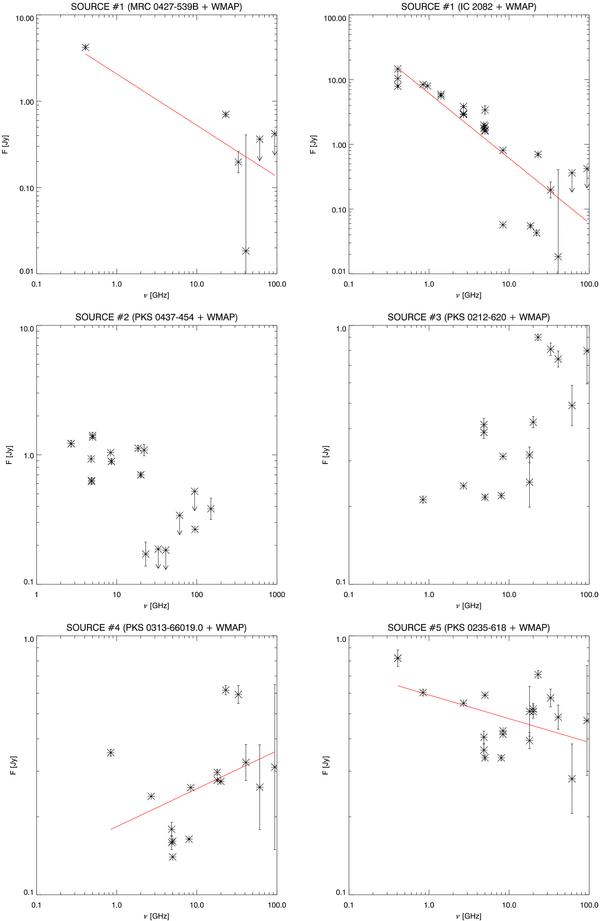
Spectral energy distribution for the new sources using the derived WMAP data and NED data of the possible counterparts. The arrows represent upper limits corresponding to 3σ, where σ was obtained from the pixel noise. The WMAP data are plotted with data from MRC 0427-539B and IC 2082 for Source # 1, PKS 0437-454 for Source # 2, PKS 0212-620 for Source # 3, PKS 0313-66019.0 for Source # 4 and PKS 0235-618 for Source # 5. For the Sources # 1, # 4, and # 5 , it is also plotted the BCES(Y | X) ordinary least-squares regression lines.
Current usage metrics show cumulative count of Article Views (full-text article views including HTML views, PDF and ePub downloads, according to the available data) and Abstracts Views on Vision4Press platform.
Data correspond to usage on the plateform after 2015. The current usage metrics is available 48-96 hours after online publication and is updated daily on week days.
Initial download of the metrics may take a while.