Fig. 4
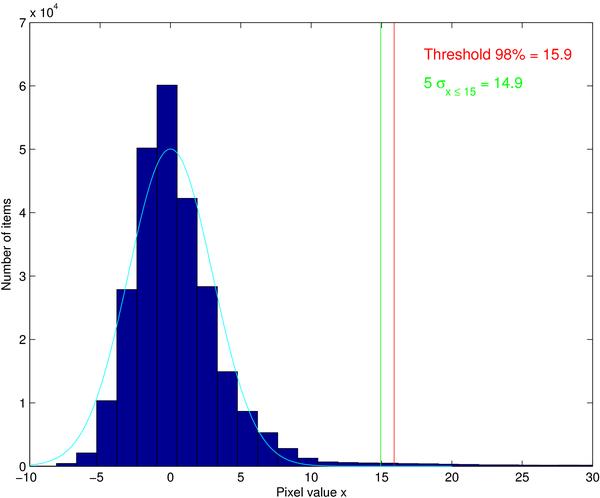
Empirical probability density function (EPDF) of the pixel values for the linear composition map of the first sky region after the application of the filter. The EPDF is different from zero in the range [− 11, 132] . Here, only the range [− 10, 30] is shown because outside this interval the EPDF is close to zero. The vertical red and green lines show the detection threshold based on the 98th percentile and the 5σ15 level, respectively. Here, σ15 is the standard deviation of the pixels with values less or equal to 15. The cyan line provides the Gaussian probability density function with zero mean and standard deviation given by σ15.
Current usage metrics show cumulative count of Article Views (full-text article views including HTML views, PDF and ePub downloads, according to the available data) and Abstracts Views on Vision4Press platform.
Data correspond to usage on the plateform after 2015. The current usage metrics is available 48-96 hours after online publication and is updated daily on week days.
Initial download of the metrics may take a while.