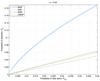
Fig. 1
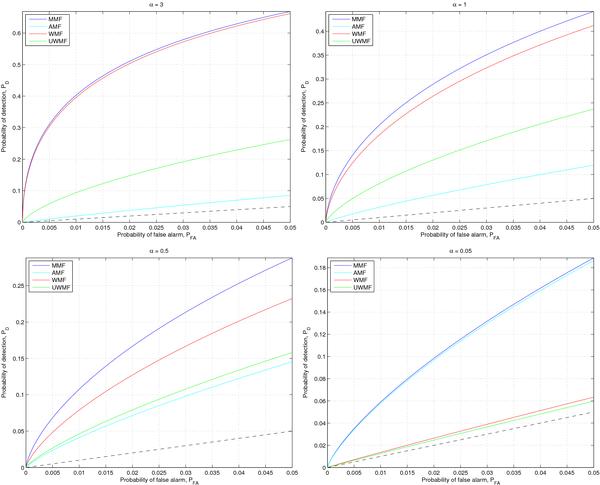
Probability of detection PD against probability of false alarm PFA for the detection methods in the numerical experiment described in Sect. 3. The sources are assumed to have an intensity ai at the ith frequency given by ai = (νi/ν1)αa1, with a1 = 0.5. Four values for α are considered, α = 3,1,0.5,0.05. The results are shown for the different methods: the weighted matched filter (WMF), the multi-frequency matched filter (MMF), the uniformly weighted matched filter (UWMF) and the average matched filter (AMF). The MMF is used as benchmark because it has the best theoretical detection performance. The UWMF shows the worst possible results obtainable with the WMF approach. The AMF shows which results are obtainable when the maps are simply averaged. A method is superior to another one when for a fixed PFA the corresponding PD is greater (for a given method, the relation PD to PFA should always be well above a 45° straight line, the dashed line in the figure). With increasing α, the behaviour of MMF and WMF becomes similar. For an α close to zero, the MMF and AMF show a very similar performance.
Current usage metrics show cumulative count of Article Views (full-text article views including HTML views, PDF and ePub downloads, according to the available data) and Abstracts Views on Vision4Press platform.
Data correspond to usage on the plateform after 2015. The current usage metrics is available 48-96 hours after online publication and is updated daily on week days.
Initial download of the metrics may take a while.