Fig. 6
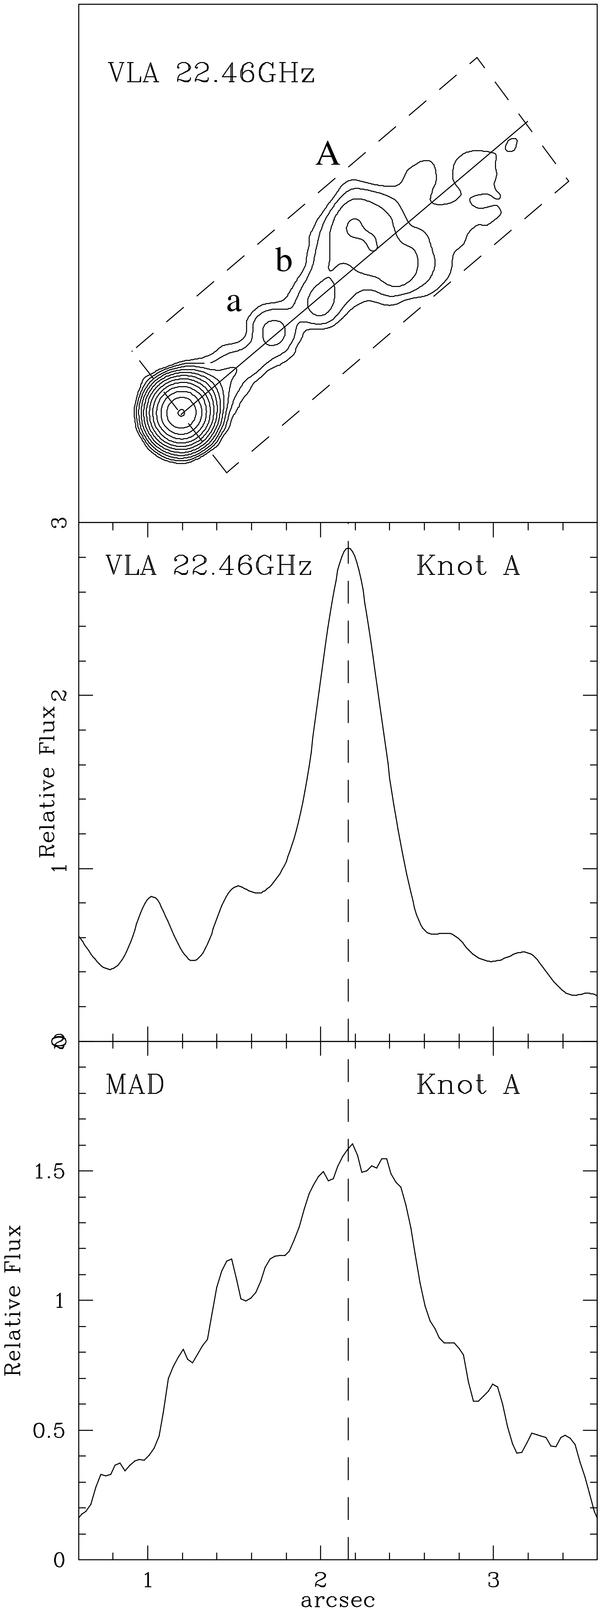
Longitudinal profile of the jet of PKS 22101+044 as observed in radio band by VLA at 22.46 GHz (middle panel) and by MAD at VLT in Ks band (bottom panel). The top panel shows the box (dashed line) in which the signal is integrated. The solid line represents the jet direction. The units of the y-axis are counts pixels-1 adequately scaled permitting an acceptable comparison between the frequencies analysed. The zero point corresponds to the core position. Knots a, b and A are labeled.
Current usage metrics show cumulative count of Article Views (full-text article views including HTML views, PDF and ePub downloads, according to the available data) and Abstracts Views on Vision4Press platform.
Data correspond to usage on the plateform after 2015. The current usage metrics is available 48-96 hours after online publication and is updated daily on week days.
Initial download of the metrics may take a while.