Fig. 3
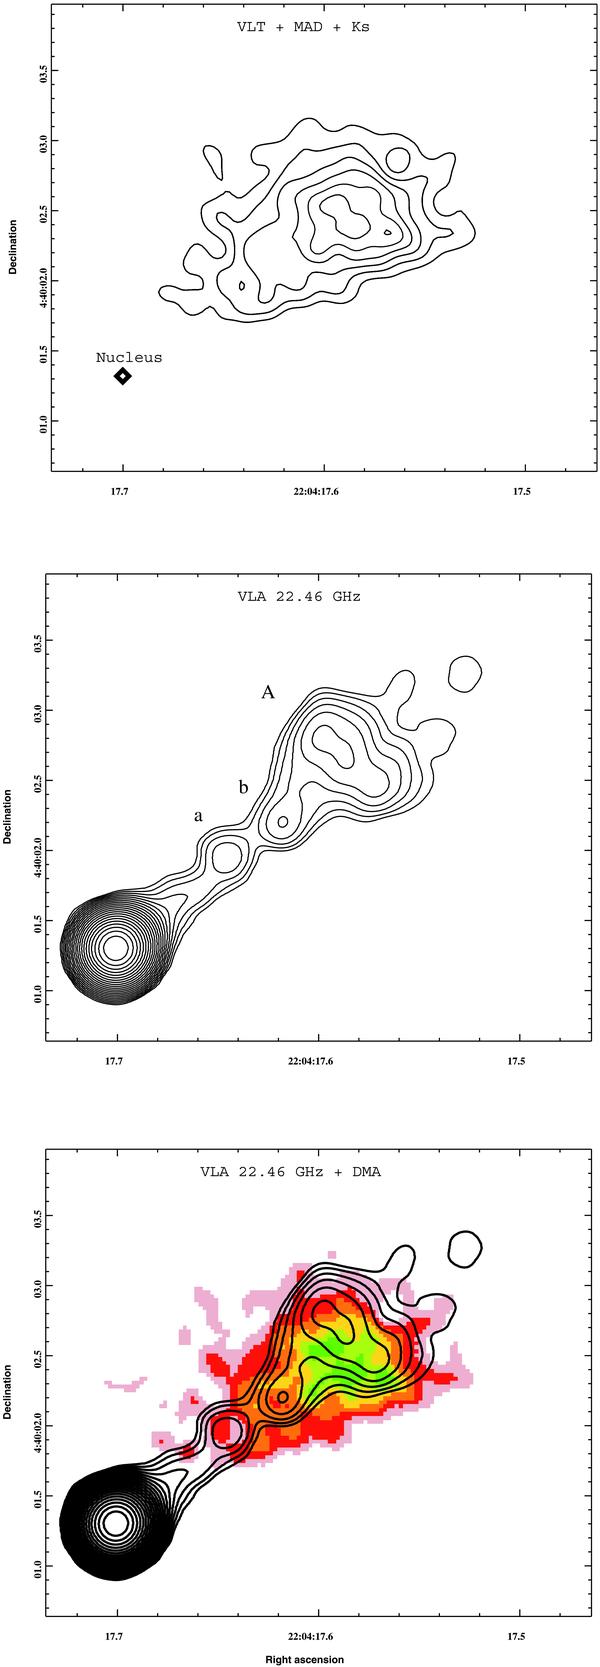
Top panel: contour plot of the jet emission of PKS 2201+044 observed by MAD in the Ks band. The diamond represents the position of the core. Middle panel: image of the jet observed in radio band at 22.46 GHz with VLA (Sambruna et al. 2007). The resolution is 0.25 arcsec. Contour levels are 0.2, 0.3, 0.4, 0.6, 0.8, 1, 2, 4, 8, 12, 15, 30, 50, 60, 100 and 200 mJy/beam. The peak level is 0.28 Jy/beam. Bottom panel: NIR jet emission (colour scale) of PKS 2201+044 overimposed to VLA radio emission at 22.46 GHz (contour map).
Current usage metrics show cumulative count of Article Views (full-text article views including HTML views, PDF and ePub downloads, according to the available data) and Abstracts Views on Vision4Press platform.
Data correspond to usage on the plateform after 2015. The current usage metrics is available 48-96 hours after online publication and is updated daily on week days.
Initial download of the metrics may take a while.