| Issue |
A&A
Volume 528, April 2011
|
|
|---|---|---|
| Article Number | A12 | |
| Number of page(s) | 22 | |
| Section | Extragalactic astronomy | |
| DOI | https://doi.org/10.1051/0004-6361/201015566 | |
| Published online | 17 February 2011 | |
The neutral gas extent of galaxies as derived from weak intervening Ca ii absorbers⋆,⋆⋆
1
Institut für Physik und Astronomie, Universität Potsdam,
Karl-Liebknecht-Str. 24/25,
14476
Golm,
Germany
e-mail: This email address is being protected from spambots. You need JavaScript enabled to view it.
2
Department of Astronomy and Astrophysics, Pennsylvania State
University, University
Park, PA
16802,
USA
3
Centre for Astrophysics & Supercomputing, Swinburne
University of Technology, Hawthorn, Victoria
3122,
Australia
Received: 11 August 2010
Accepted: 3 December 2010
Abstract
We present a systematic study of weak intervening Ca ii absorbers at low redshift (z < 0.5), based on the analysis of archival high-resolution (R ≥ 45 000) optical spectra of 304 quasars and active galactic nuclei observed with VLT/UVES. Along a total redshift path of Δz ≈ 100 we detected 23 intervening Ca ii absorbers in both the Ca ii H & K lines, with rest frame equivalent widths Wr,3934 = 15−799 mÅ and column densities log N(Ca ii) = 11.25−13.04 (obtained by fitting Voigt-profile components). We obtain a bias-corrected number density of weak intervening Ca ii absorbers of  at ⟨zabs⟩ = 0.35 for absorbers with log N(Ca ii) ≥ 11.65 (Wr,3934 ≥ 32 mÅ). This is ~2.6 times the value obtained for damped Lyman α absorbers (DLAs) at low redshift. All Ca ii absorbers in our sample show associated absorption by other low ions such as Mg ii and Fe ii; 45 percent of them have associated Na i absorption. From ionization modelling we conclude that intervening Ca ii absorption with log N(Ca ii) ≥ 11.5 arises in DLAs, sub-DLAs and Lyman-limit systems (LLS) at H i column densities of log N(H i) ≥ 17.4. Using supplementary H i information for nine of the absorbers we find that the Ca ii/H i ratio decreases strongly with increasing H i column density, indicating a column-density-dependent dust depletion of Ca. The observed column density distribution function of Ca ii absorption components follows a relatively steep power law, f(N) ∝ N − β, with a slope of − β = −1.68, which again points towards an enhanced dust depletion in high column density systems. The relatively large cross section of these absorbers together with the frequent detection of Ca ii absorption in high-velocity clouds (HVCs) in the halo of the Milky Way suggests that a considerable fraction of the intervening Ca ii systems trace (partly) neutral gas structures in the halos and circumgalactic environment of galaxies (i.e., they are HVC analogs). Based on the recently measured detection rate of Ca ii absorption in the Milky Way HVCs we estimate that the mean (projected) Ca ii covering fraction of galaxies and their gaseous halos is ⟨fc,CaII⟩ = 0.33. Using this value and considering all galaxies with luminosities L ≥ 0.05 L ⋆ we calculate that the characteristic radial extent of (partly) neutral gas clouds with log N(H i) ≥ 17.4 around low-redshift galaxies is RHVC ≈ 55 kpc.
Key words: galaxies: halos / galaxies: formation / galaxies: ISM / intergalactic medium / quasars: absorption lines
Based on observations collected at the European Organisation for Astronomical Research in the Southern Hemisphere, Chile.
Appendices are only available in electronic form at http://www.aanda.org
© ESO, 2011
1. Introduction
The analysis of intervening absorption lines in the spectra of distant quasars (QSO) has become an extremely powerful method to study the distribution and physical properties of the intergalactic medium (IGM) and its relation to galaxies. Over the last couple of decades, QSO absorption spectroscopy of various metal ions such as Mg ii and C iv, together with galaxy imaging, has been used extensively to constrain the nature of the various processes (infall, outflow, merging) that govern the matter exchange between galaxies and the IGM as part of the hierarchical evolution of galaxies (e.g., Bergeron & Boissé 1991; Churchill et al. 1999; Steidel et al. 2002).
Because of the physical and spatial complexity of the IGM and the various hydrodynamical processes that are involved, our knowledge about the exact role of the IGM-galaxy connection for the evolution of galaxies at low and high redshift is still incomplete. In particular, it is not known whether the gas infall onto galaxies occurs in the form of condensed neutral gas clouds (“cold” mode) or in the form of ionized gas (“warm” or “hot” mode; see, e.g., Bland-Hawthorn 2009). It also remains to be determined what consequences the accretion mode has for the star-formation activity of a galaxy. Part of this lack of understanding (particularly at low redshift) is related to observational limitations. Since, by far, most of the ion transitions of interest for QSO absorption spectroscopy are located in the ultraviolet (UV), QSO absorption line observations at low redshift are limited by the number of bright extragalactic background sources for which high-resolution UV spectroscopy with current space-based spectrographs (i.e., HST/STIS or HST/COS) can be carried out. At higher redshift, more and more UV lines are redshifted into the optical regime, allowing us to obtain a much larger number of high-quality QSO absorption spectra with large, ground-based telescopes such as the ESO Very Large Telescope (VLT). Because galaxies at high redshift are dim, however, the characterization of the IGM-galaxy connection at high z using direct observations is a challenging task (Adelberger et al. 2003; Crighton et al. 2010). Fortunately, hydrodynamical simulations of the IGM have turned out to be an extremely valuable tool to assess the properties of intergalactic matter and its relation to galaxies at high and low redshifts (e.g., Fangano et al. 2007; Kaufmann et al. 2009; Kacprzak et al. 2010a).
Most of the recent absorption line studies of intervening systems have concentrated on the analysis of ionic transitions of hydrogen and heavy elements in the UV (e.g., H i, Mg ii, C iv, O vi, and many others). The two most important optical absorption lines for IGM studies, the Ca ii H & K lines near 4000 Å, are less commonly used, although they have also played an important role in our understanding of the diffuse matter in space. With an ionization potential of 11.9 eV Ca ii serves as a tracer of warm and cold, neutral gas in galaxies and their gaseous halos. After all, the Ca ii H & K lines were the first absorption lines ever detected in interstellar gas (Hartmann 1904). These lines were also the first tracers of extraplanar gas clouds in the halo of the Milky Way (Münch 1952) and were among the first metal absorption lines detected in the IGM in early QSO spectra (see Blades 1988).
Bowen (1991), Bowen et al. (1991), and, more recently, Wild et al. (2006, 2007), Zych et al. (2007, 2009) and Nestor et al. (2008) have investigated intervening Ca ii absorbers towards QSOs at relatively low spectral resolution. From the early studies by Bowen et al. (using a small sample of medium resolution optical QSO spectra) it was concluded that intervening Ca ii absorption predominantly occurs within the inner 20 kpc of galaxies, thus speaking against many galaxies having extended Ca ii absorbing neutral gas halos with large filling factors. From the analysis of several thousand low-resolution spectra from the Sloan Digital Sky Survey (SDSS) Wild et al. (2006) concluded that strong Ca ii systems with rest frame equivalent widths > 350 mÅ arise only from the inner regions of galaxies and thus represent a subclass of the damped Lyman α absorbers (DLAs). These have the highest H i column densities of all intervening QSO absorbers (log N(H i) ≥ 20.3) and are believed to represent gas-rich galaxies and protogalactic structures.
However, because of their limited spectral resolution and their typically low signal-to-noise ratios (S/N), previous studies would have missed a population of weak, intervening Ca ii absorbers with rest frame equivalent widths ≤ 100 mÅ. The existence of these weak Ca ii systems was recently indicated by high-resolution observations of weak Ca ii absorption in the halo and nearby intergalactic environment of the Milky Way (Richter et al. 2005, 2009; Ben Bekhti et al. 2008; Wakker et al. 2007, 2008). It was found that Ca ii absorption is common in the many neutral gas structures outside the Milky Way disk (i.e., in the so-called “high velocity clouds”, HVCs), even at low H i gas column densities, N(H i) ~ 1017 − 1019 cm-2. If the Milky Way environment is typical for low-redshift galaxies, weak Ca ii absorption should arise in both the neutral gas disks of galaxies and in their extended, patchy neutral gas halos (i.e., in HVC analogs), but high sensitivity is required to detect the halo component. In terms of the common QSO absorption line classification this implies that Ca ii absorption should arise in DLAs as well as in a certain fraction of sub-DLAs (19.3 < log N(H i) ≤ 20.3) and Lyman limit systems (LLS; 17.2 < log N(H i) ≤ 19.3), depending on the Ca abundance and dust depletion in the gas and the local ionization conditions.
The common detection of weak Ca ii absorption in the Milky Way’s extended neutral gas halo therefore suggests that the occurrence of Ca ii absorption in the gaseous outskirts of low-redshift galaxies should be reassessed with high resolution, high S/N absorption line data. Such a study may be very useful to constrain the absorption cross section of neutral gas in the local Universe. Most importantly, it can be used to measure the sizes and masses of neutral gas galaxy halos. The latter point is particularly interesting, as knowledge about the neutral gas distribution around galaxies below the H i 21 cm detection limit of current radio telescopes may be crucial for our understanding of gas accretion rates of galaxies at low redshift (cold accretion vs. warm accretion; see Bland-Hawthorn 2009). Because intervening Ca ii absorbers should trace neutral gas at column densities log N(H i) > 17 it is expected that they are relatively rare. Their number densities should be lower than the value of dN/dz ≈ 0.6 at z = 0.3, derived for the so-called “strong” Mg ii systems (systems with rest frame equivalent widths ≥ 0.3 Å in the Mg ii λ 2976 line; see Nestor et al. 2005), but higher than that of DLAs (dN/dz = 0.045 at z = 0; Zwaan et al. 2005). Therefore, a large number of QSO sightlines must be surveyed in order to study the properties of intervening Ca ii systems on a statistically secure basis.
We here present the first systematic study of weak intervening Ca ii absorbers in the redshift range z = 0 − 0.5, based on a very large sample of more than 300 optical, high-resolution (R > 40 000) QSO absorption line spectra obtained with the VLT. Our paper is organized as follows. In Sect. 2 we present the observations, the data handling, and the analysis method. The main results of our survey are presented in Sect. 3. In Sect. 4 we discuss the physical properties and the origin of the weak intervening Ca ii systems. We compare our results with previous studies of intervening Ca ii absorbers in Sect. 5. Finally, we present a summary of our study in Sect. 6.
2. Observations, data handling, and analysis method
2.1. Spectra selection and reduction
For our Ca ii survey we made use of the ESO data archive1 and retrieved all publically available (as of Sep. 2008) absorption-line data for low- and high-redshift QSOs observed with the Ultraviolet and Visual Echelle Spectrograph (UVES) on the VLT. This enormous data archive (Spectral Quasar Absorption Database, SQUAD; PI: M.T. Murphy) provides high-quality spectral data for ~400 quasars and active galactic nuclei (AGN). Most of these spectra were taken in the UVES standard configuration using the 1′′ slit, providing a spectral resolution of R ~ 45 000 (corresponding to a velocity resolution of ~6.6 km s-1FWHM). Only a few spectra have been observed at slightly higher spectral resolution, up to R ~ 60 000. The spectral coverage as well as the signal-to-noise ratio (S/N) varies substantially among the spectra, reflecting the various scientific goals of the original proposals.
All data were reduced using a modified version of the UVES reduction pipeline. The modifications were implemented to improve the flux extraction and wavelength calibration for the different echelle orders. Different orders then were combined using the custom-written code UVES_popler with inverse variance weighting and a cosmic ray rejection algorithm, to form a single spectrum with a dispersion of 2.5 km s-1 per pixel. Finally, the spectra were continuum-normalized with an automated continuum fitting algorithm.
Because we aim to analyse Ca ii H&K (λλ3934.77,3969.59) absorption in the redshift range z = 0 − 0.5, we are interested in the wavelength range between 3934 and 5955 Å. From all 397 available quasar spectra in the SQUAD sample we selected the 304 spectra that a) fully or partly cover the above mentioned wavelength range, and b) have an average S/N of ≥ 12 per ~ 6.6 km s-1 wide resolution element for R = 45 000; see above). Note that we require the occurrence of both Ca ii absorption lines in the spectrum for a positive detection (see also Sect. 2.2). The minimum column density that can be detected at 4σ significance for an unresolved, optically thin absorption line at wavelength, λ0, with oscillator strength, f, in a spectrum with a given S/N per resolution element and a spectral resolution R = λ/Δλ can be calculated (e.g., Tumlinson et al. 2002; Richter et al. 2001) via  (1)In our case we have λ0 = 3969.59 Å and f = 0.3145 for the weaker of the two Ca ii lines, so that the minimum S/N of 12 in our sample corresponds to a column density threshold of N(Ca ii) = 6.7 × 1011 cm-2 (log N(Ca ii) = 11.83) for R = 45 000. This column density limit corresponds to an equivalent width limit of 50 mÅ in the stronger Ca ii λ3934 line.
For all 304 selected QSO spectra we then scanned the spectral region of interest (3934 − 5955 Å) and excluded from further analysis those regions that are contaminated by Ly α forest lines and other spectral features that would cause severe blending problems. As a result, we define for each sightline a characteristic redshift path dzCaII ≤ 0.5 (typically composed of several redshift chunks) along which intervening Ca ii could be detected. The mean redshift path per sightline in our sample is ⟨dzCaII⟩ = 0.33; the total redshift path is Δz = 100.60.
A table listing all selected 304 spectra with the QSO names, the average S/N, and dzCaII is provided in the Appendix (Table A.3).
2.2. Absorber identification and line fitting
The next step in our analysis was the search for Ca ii H&K absorption at z = 0 − 0.5 along the 304 selected QSO sightlines. First, we used an automated line-finder algorithm to identify absorption features whose wavelengths would correspond to combined Ca ii H&K absorption in intervening absorbers at z ≤ 0.5. In this way we created a candidate list of possible Ca ii systems. Secondly, two of our team (Richter & Krause) independently analysed all 304 spectra by eye and identified possible Ca ii systems. All three candidate lists then were merged into one. For each of the candidate systems we then checked for associated absorption in Mg ii λλ2796,2803, Fe ii λλ2586,2600, and Na i λλ5891,5897 to verify or exclude the presence of intervening gas absorption at the redshift indicated by the candidate Ca ii absorption. A large number of false detections is expected, caused by intervening absorption lines that coincidently mimic the wavelength pattern expected for a redshifted Ca ii doublet. For a positive detection we thus require that both Ca ii lines are clearly detected and that the two lines show a similar pattern of absorption components and similar line shapes.
 |
Fig. 1 UVES spectrum of the quasar J215501−092224 in the wavelength range between 4240 and 4300 Å. Weak intervening Ca ii absorption is clearly detected at z = 0.08091 in both Ca ii lines, as indicated by the tick marks. |
For a positive detection at redshift z ≥ 0.2 we further require that the Ca ii absorption is accompanied by absorption in Mg ii or Fe ii. For all possible Ca ii systems at z ≥ 0.2 a Mg ii and/or a strong Fe ii transition is covered. The detection of one of these ions at the same redshift as Ca ii proves the presence of an intervening Ca ii system, whereas the significant non-detection of Mg ii and Fe ii indicates a false detection. The mandatory coexistence of Mg ii and Fe ii with Ca ii is justified given relative abundances of these ions, their ionization potentials, and the oscillator strengths of the above listed transitions. Ca ii absorbing clouds without significant Mg ii and Fe ii absorption are not expected to exist.
The situation is different for redshifts z < 0.2, where we have no coverage of associated Mg ii and Fe ii absorption in our optical spectra. Generally, the significant non-detection of Na i in a Ca ii candidate system does not indicate a false Ca ii detection. Na i exists only in relatively dense neutral gas and thus is present only in a subset of the Ca ii systems. Fortunately, in our particular survey, all but one Ca ii candidate systems at z < 0.2 for which Na i was covered in the optical spectrum, did happen to have Na i detected. Furthermore, the only Ca ii candidate system at z < 0.2 for which Na i was not detected (the system towards J215501-092224), could be confirmed by existing UV absorption line data from HST/STIS (Jenkins et al. 2003).
Finally, as a check to our procedure, and in order to identify weaker Ca ii absorbers, we reversed our search and looked for Ca ii absorption in (previously identified) strong MgII absorbers at z = 0.2 − 0.5. In this way, we identified four very weak Ca ii absorbers, with N(Ca ii) < 11.5, which we had missed in our direct search for Ca ii. We also found a number of Ca ii absorber candidates, for which only one of the two Ca ii lines is seen, e.g., in systems so weak that Ca iiλ3969 was not formally detected, or in which one member of the Ca ii doublet was blended or was not covered in the spectrum (see Jones et al. 2010, for an example case). These candidate systems are not considered any further in our analysis, but they are listed in the Appendix in Table A.2. We moreover excluded all local Ca ii absorption features at radial velocities 0 − 500 km s-1, as these features are caused by neutral gas in the Milky Way disk and halo (see Ben Bekhti et al. 2008).
Using the above outlined detection criteria a final list of verified Ca ii absorbers was produced. As an example we show in Fig. 1 the UVES spectrum of the quasar J215501−092224 in the wavelength range between 4240 and 4300 Å. Weak intervening Ca ii absorption is clearly detected at z = 0.08091 in both Ca ii lines (indicated by the tick marks). For the further spectral analysis of the absorption lines we made use of the FITLYMAN package implemented in the ESO-MIDAS analysis software (Fontana & Ballester 1995). This routine uses a χ2 minimization algorithm to derive column densities (N) and Doppler parameters (b) via multi-component Voigt profile fitting, also taking into account the spectral resolution of the instrument. An example for a multicomponent Voigt profile fit of an intervening Ca ii absorber is shown in Fig. 2. Total Ca ii column densities for each system have been determined by summing over the the column densities of the individual subcomponents. The total rest frame equivalent widths (Wr) and velocity widths of the absorption (Δv) were derived for Ca ii λ3934, as well as for associated Mg ii λ2796 absorption, by a direct pixel integration.
3. Results
 |
Fig. 2 Example for a Voigt-profile fit (red solid line) with four absorption components of the Ca ii absorber at z = 0.23782 towards J095456+174331. |
3.1. Frequency and column densities of Ca ii absorbers
Based on the analysis method described in the previous section we found 23 intervening Ca ii absorbers along the selected 304 QSO sightlines. The redshift of the absorbers ranges between z = 0.00396 and z = 0.47439. Note that several of these absorption systems represent DLAs and LLSs that have been identified and studied previously, based on the analysis of ions other than Ca ii (e.g., Mg ii). Consequently, it is expected that some of our QSO sightlines that exhibit intervening Ca ii absorption have been explicitly selected (based on lower resolution spectra) to study the absorption characteristics of DLAs and LLSs at low z, and thus represent targeted observations. Therefore, one important concern about the detection rate of intervening Ca ii in our data is the selection bias in the QSO sample that we are using. This issue will be further discussed in Sect. 3.2, where we estimate the number density of Ca ii absorbers at low redshift.
Quasar names, redshifts and detected (and undetected) ions for the 23 Ca ii absorption systems are listed in Table 1. Detailed results from the Voigt-profile fitting of the absorbers and their subcomponents are listed in Table A.1 in the Appendix. Velocity plots of Ca ii and other detected ions for all 23 absorbers are shown in the Appendix, in Fig. A.1. Total column densities, absorption components, velocity widths, and equivalent widths for the 23 Ca ii absorbers and for their associated Mg ii absorption are given in Table 2.
The total logarithmic Ca ii column densities of the absorbers range between log N(Ca ii) = 11.25 and 13.04. The distribution of the (total) logarithmic Ca ii column densities of the 23 absorbers as well as the distribution of their redshifts are shown in Fig. 4. The Ca ii column density distribution has a peak near log N(Ca ii) ~ 12.2, which is also the median value. If we remove the eight systems that are flagged as “biased” in Table 1, the median value for log N is reduced to ~ 11.9 (for details on the selection bias see Sect. 3.2). The redshift distribution of the absorbers (Fig. 4, right panel) is nonuniform, showing an enhancement of Ca ii systems in the range z = 0.2 − 0.4. This is because of the inhomogeneous redshift coverage of our QSO sample and not because of an intrinsic redshift evolution of the absorber population (see Sect. 3.2). The median absorption redshift in our total sample (23 systems) is zabs = 0.32 (0.35 in the bias-corrected sample).
QSO names, redshifts and ions of 23 intervening Ca ii absorbers at z = 0 − 0.5 detected in our QSO sample.
 |
Fig. 3 Relative redshift coverage for Ca ii absorption for 270 QSO sigthlines, along which intervening Ca ii absorption can be detected at column densities log N(Ca ii) > 11.65. |
Column densities, absorption components, velocity widths and equivalent widths for the 23 intervening Ca ii absorbers.
3.2. Number density of Ca ii absorbers
To calculate the number density of intervening Ca ii absorbers per unit redshifz,  , it is necessary to consider in detail the completeness of our Ca ii survey and the selection bias in our data sample.
The weakest Ca ii system in our survey has log N(Ca ii) = 11.25, but only 103 of the 304 spectra have a sufficiently high S/N to detect Ca ii at this column density level (see Eq. (1)). Eighteen Ca ii absorbers have log N(Ca ii) > 11.65 (these were found by the direct search for intervening Ca ii absorption; see Sect. 2.2) and for 270 out of 304 sightlines the selected spectral regions are sensitive above this column density level. For completeness reasons we therefore consider only the total redshift path covered by these 270 sightlines, together with the 18 absorbers that have log N(Ca ii) > 11.65, for the estimate of the Ca ii absorber number density.
 |
Fig. 4 Distribution of (total) logarithmic Ca ii column densities of the 23 absorbers detected in our total QSO sample (left panel) and their redshift distribution (right panel). |
The relative redshift coverage, fz(z), for Ca ii absorption along the selected 270 sightlines (fz(z) = ∑ dz(z)/270) is shown in Fig. 3. The distribution reflects blending issues and low S/N for many high-redshift sightlines in the range zCaII < 0.25, as well as individual features caused by the integrated wavelength coverage of the original UVES observations in our sample. The total redshift path for the selected 270 sightlines is Δz = 89.15.
To quantify the selection bias in our data we inspected the original proposal abstracts in the UVES archive for the sightlines along which intervening Ca ii was found. As it turns out, 8 out of the 18 QSO spectra with intervening Ca ii absorption at log N(Ca ii) > 11.65 represent data from targeted observations of DLAs and Mg ii absorbers at low redshift (as indicated in Table 1, Col. 4). This implies that our sample contains ~ 40 percent more Ca ii systems per unit redshift than in a fully random QSO sample.
 |
Fig. 5 Distribution of Ca ii λ3934 rest frame equivalent widths for the 23 Ca ii absorbers (left panel) and their velocity width distribution (right panel). |
Another way to check for a possible selection bias in our data is to compare the frequency of Mg ii absorption systems in our sample with that of securely unbiased absorber searches (e.g., from spectra of the Sloan Digital Sky Survey, SDSS). Intervening Mg ii absorbers commonly are divided into “weak” systems (for rest-frame equivalent widths in the λ2976 line, W2796 ≤ 300 mÅ) and “strong” systems (W2796 ≥ 300 mÅ). From a Mg ii-selected absorber search of our data we find that strong Mg ii systems outnumber Ca ii systems with log N(Ca ii) > 11.65 by a factor of ~ 5. Moreover, Ca ii systems above a column density limit of log N = 11.65 arise exclusively in strong Mg ii systems, but not in weak Mg ii absorbers. Therefore, the number densities of strong Mg ii absorbers and Ca ii systems with log N(Ca ii) > 11.65 can be directly compared to each other. From our data we estimate  for strong Mg ii systems at ⟨z⟩ = 0.3. The study by Nestor et al. (2005) based on SDSS data, however, indicates a lower value of
  for this redshift. These numbers further suggest a substantial, ~ 40 percent overabundance of strong Mg ii systems, and thus Ca ii systems with log N(Ca ii) > 11.65 in our QSO sample, owing to a selection bias.
 |
Fig. 6 Distribution of Doppler parameters (b values) of the 69 Ca ii absorption components in our 23 Ca ii systems (left panel), and number of absorption components per system (right panel), derived from Voigt-profile fitting. |
Without any bias correction our detection of 18 Ca ii absorbers with log N(Ca ii) > 11.65 along a total redshift path of Δz = 89.15 implies (Ca ii) = 0.202 ± 0.048 for this column density range. Considering the above estimate for the selection bias (40 percent) and removing the eight relevant sightlines from the statistics we derive a bias-corrected number density of intervening Ca ii systems with log N(Ca ii) > 11.65 of (Ca ii) = 0.117 ± 0.044. The error includes a 20 percent uncertainty estimate for the bias correction. For comparison, the number density of DLAs at low redshift is (DLA) ≈ 0.045 (Zwaan et al. 2005), thus a factor of 2.6 lower. This is an interesting and important result: weak intervening Ca ii absorbers at low redshift outnumber DLAs by a factor of two to three.
If we transform dz into the comoving absorption path length dX via ![Mathematical equation: \begin{equation} {\rm d}X=(1+z)^2\,[\Omega_{\Lambda}+\Omega_{\rm m}(1+z)^3]^{-0.5}\,{\rm d}z, \end{equation}](/articles/aa/full_html/2011/04/aa15566-10/aa15566-10-eq125.png) (2)the data indicate
(2)the data indicate  for ⟨zabs⟩ = 0.35 (bias corrected). Thoughout this paper we use a flat ΛCDM cosmology with H0 = 73 km s-1 Mpc-1, Ωm = 0.238, and ΩΛ = 0.762 (Spergel et al. 2007).
3.3. Ca ii equivalent and velocity widths
The Ca ii rest-frame equivalent widths for the stronger λ3934 transition, Wr,3934, range from 15 to 799 mÅ in our sample (see Table 2). The equivalent width distribution is shown in Fig. 5, left panel. Most absorbers (18 out of 23) have Wr < 200 mÅ; note that these systems would be invisible in spectral data with low spectral resolution and/or low S/N (e.g., in most SDSS spectra). The median rest-frame equivalent width in the λ3934 line is 118 mÅ (76 mÅ in the unbiased sample). If we divide our absorber sample into “strong” absorbers with Wr ≥ 300 mÅ and “weak” absorbers with Wr < 300 mÅ (similar to the divisions for Mg ii), our sample contains 21 weak absorbers, but only two strong systems. Our study thus indicates that weak Ca ii absorbers with 32 ≤ Wr,3934 < 300 mÅ2 are eight times more numerous than strong absorbers.
Figure 5, right panel, shows the distribution of the absorption width of the Ca ii systems, Δvabs, as derived from the Ca ii absorption profiles. The absorption width is defined as the total velocity range in which Ca ii λ3934 absorption (including all velocity subcomponents) is detected in a system. The Ca ii absorption widths range from 22 to 378 km s-1, but only two of the 23 systems show large widths with Δv > 200 km s-1. For Δv < 200 km s-1 the distribution of the 21 systems is bimodal with 10 narrow absorbers with Δv < 50 km s-1, and 9 somewhat broader systems with velocity widths between 100 and 150 km s-1. The median value for the velocity width of Ca ii is 60 km s-1 (40 km s-1 for the unbiased sample). While the typical velocity spread of intervening Ca ii absorbers is < 150 km s-1, the associated Mg ii covers an absorption range that typically is several times larger than that for Ca ii. This will be further discussed in Sect. 3.6.
3.4. Doppler parameters and subcomponent structure
The distribution of the Doppler parameters of all individual 69 absorber subcomponents is shown in the left panel of Fig. 6. The distribution peaks at b = 4 km s-1 with a broad tail that extends to b = 20 km s-1. The median value is b = 6 km s-1. In absorption spectroscopy of extended gaseous structures it is usually assumed that the total (=measured) Doppler parameter of an absorber is composed of a thermal component (bth) and a non-thermal component (bturb), so that  . The thermal component of b depends on the gas temperature, T, and the mass (m) or atomic weight (A) of the particle, where bth = (2kT/m)1/2 ≈ 0.129 (T[K]/A)1/2 km s-1. The non-thermal component includes macroscopic motions in the gas, such as turbulence and flows. Assuming pure thermal broadening (i.e., bturb = 0 km s-1), Ca ii Doppler parameters of (5,10,15,20) km s-1 therefore correspond to logarithmic gas temperatures, log (T/K), of (4.8,5.4,5.7,6.0). Since the temperature of the Ca ii absorbing gas is likely to be much lower than that (a characteristic temperature range is T = 102 − 104 K; see Richter et al. 2005; Ben Bekhti et al. 2008), this would suggest that the measured Ca ii b values are dominated by turbulent motions in the gas. Alternatively, the observed non-thermal line widths may be partly due to unresolved subcomponent structure in the lines, which is plausible in view of the limited spectral resolution of the data (FWHM ≈ 6.6 km s-1 for most of the spectra). In either case, the measured Doppler parameters of the Ca ii absorption components unfortunately cannot be used to constrain the gas temperature in the absorbers.
 |
Fig. 7 Column density distribution function, f(N), for Ca ii components, as derived from our bias-corrected Ca ii absorber sample. Above our completeness limit (log N = 11.65; dotted line), the data fit best to a power law of the form f(N) = C N − β with slope β = 1.68 ± 0.20 (solid line). |
Figure 6, right panel, shows the number of absorption components that we resolved in each Ca ii system. Seventeen out of the 23 Ca ii absorbers (i.e., 74 percent) have three or fewer absorption components within a velocity range of ≤150 km s-1, and seven systems are single-component Ca ii absorbers. The mean velocity separation between Ca ii absorption sub-components is only ~25 km s-1, which suggests that the individual subcomponents are physically connected (e.g., as part of a coherent gas structure). Note that the velocity width of an absorber (see above) is correlated with the the number of absorption components (see Table 3).
3.5. Column density distribution function (CDDF)
In Fig. 7 we show the column density distribution function (CDDF) of the 37 Ca ii absorption components found in the unbiased absorber sample. Following Churchill et al. (2003), the CDDF can be written as f(N) = m/ΔN, where m denotes the number of absorbers in the column density bin ΔN. Integration of f(N) over the total column density range of interest then delivers the total number of absorbers in that range. The CDDF of low and high ion absorbers in intervening absorption line systems usually follows a power law in the form  (3)where β varies in the range between 1 and 2 for different ions (e.g., β ≈ 1.5 for H i and Mg ii; Kim et al. 2001; Churchill et al. 2003). Fitting f(N) to the 37 Ca ii absorption components we find β = 1.68 ± 0.20 and log C = 9.05 ± 2.42 for all absorbers that are above our completeness limit (log N(Ca ii) = 11.65). Thus, the CDDF of intervening Ca ii absorption components is mildly steeper than that of intervening H i and Mg ii. Note that a similar slope (β = 1.6 ± 0.3) has been found for the Ca ii CDDF in HVCs in the halo of the Milky Way (Ben Bekhti et al. 2008).
The relatively steep slope of the Ca ii CDDF most likely is related to the depletion of Ca into dust grains. Dust depletion is particularly important for high column density systems (see Sects. 3.6 and 4.2). This effect leads to a reduction of high column density Ca ii systems and thus is expected to cause a steepening of f(N) compared to undepleted elements. Note that if we fit the CDDF to all 69 absorption components in the total data set (i.e., including the biased absorbers and their components), the slope of the CDDF steepens substantially with β = 2.12 ± 0.17. Obviously, the biased systems predominantly add components with relatively low Ca ii column densities to the total sample, resulting in a steeper CDDF. This most likely is related to an enhanced dust depletion in the biased systems.
3.6. Associated Mg ii, Fe ii and Na i absorption
All Ca ii absorbers in our sample for which information on Mg ii and Fe ii is available (Mg ii: 18/23, Fe ii: 15/23; see Table 1 and Fig. A1) do show associated absorption in these ions, following our original selection criteria (Sect. 2.2). The equivalent widths of the associated Mg ii λλ2796,2803 and Fe ii λλ2586,2600 absorption lines are typically much larger than those of the Ca ii H&K absorption. This is expected, since Mg is 17 times and Fe is 14 times more abundant than Ca (assuming relative solar abundances for these elements: log (Ca/H)⊙ = −5.69 ± 0.04; log (Na/H)⊙ = −5.83 ± 0.04; log (Mg/H)⊙ = −4.47 ± 0.09; log (Fe/H)⊙ = −4.55 ± 0.05; Asplund et al. 2005) and the oscillator strengths of the above mentioned Mg ii and Fe ii transitions are relatively strong. Mg ii and Fe ii absorption that is associated with Ca ii systems shows a velocity-component structure that typically is far more complex than that of Ca ii. The median velocity width of Mg ii is Δv = 175 km s-1, thus substantially larger than the median velocity width of Ca ii (60 km s-1; see above). This behaviour indicates that Mg ii absorption traces more extended gaseous structures that have a larger velocity extent, while Ca ii absorption is detectable only in certain, spatially more confined regions within these structures. This is because Mg ii – in view of its larger abundance and higher ionization potential – is a much more sensitive tracer for diffuse neutral gas than Ca ii, and it also traces diffuse ionized gas (see Sect. 4.3). Therefore, the velocity pattern of Mg ii absorption reflects the overall distribution of dense and diffuse gas in the absorber, while Ca ii absorption arises only in the regions that have the highest neutral gas column densities.
 |
Fig. 8 Comparison beween Ca ii and Mg ii equivalent and velocity widths in the intervening Ca ii absorbers. |
All but one of the Ca ii absorbers in our sample, for which information on Mg ii is available, are associated with strong Mg ii absorbers. However, from our Mg ii selected absorber sample, we find that only every fifth strong Mg ii system at z ≤ 0.5 shows Ca ii absorption above log N(Ca ii) = 11.65 (see Sect. 3.2). The median rest-frame equivalent width of the Mg ii λ2976 absorption that is associated with a Ca ii system is 700 mÅ, thus about six times larger than the median Ca ii equivalent width in the λ3934 line. As shown in Fig. 8 (left panel), the Mg ii λ 2976 equivalent width correlates with the Ca ii λ3934 equivalent width, while the velocity widths of the Ca ii and Mg ii absorption do not show such a correlation (Fig. 8, right panel). The former aspect indicates that the Ca ii absorption follows only the strongest Mg ii absorption components, which dominate the total Mg ii equivalent width. This is in line with the observation that there is no obvious velocity offset between the main Ca ii and the main Mg ii absorption components. The latter aspect shows that weaker Mg ii satellite components are either not traced by Ca ii (as they may arise in predominantly ionized gas rather than in neutral gas) or they are too weak to detect in Ca ii absorption.
Supplementary information for selected absorbers in our sample.
For 11 of the 23 absorbers, information on Na i is available, and five of these systems are indeed detected in Na i absorption. The Na i column densities in the systems where Na i is detected range between log N(Na i) = 11.64 and 13.28 (see Table 2). The upper limits for log N(Na i) for the remaining six systems vary between 10.30 and 11.20. Unlike the associated Mg ii and Fe ii absorption, the observed Na i component structure in the five systems that show Na i absorption follows that of the Ca ii absorption very closely (see Fig. A1). This indicates that Ca ii and Na i absorption arises in the same physical regions. Neutral sodium has an ionization potential of only 5.1 eV (compared to 11.9 eV for Ca ii; e.g., Morton 2003) and thus is believed to serve as tracer for cold neutral gas inside galaxies (e.g., Crawford et al. 1992). However, Na i absorption is occasionally found also in HVCs in the halo of the Milky Way (Richter et al. 2005; Ben Bekhti et al. 2008) and in the winds of starbursting galaxies (Martin et al. 2005). We will further investigate the Na i/Ca ii relation in our absorbers in Sect. 4.2, where we also discuss the ionization and dust properties in the gas.
3.7. Supplementary information on the absorbers
For several of our Ca ii absorbers, supplementary information on the properties of these systems (based on previous studies) is available in the literature. Because intervening Ca ii absorption most likely arises in the inner and outer regions of galaxies, we are mostly interested in information that indicates a possible absorber-galaxy connection. Table 3 lists relevant information for seven out of the 23 QSO sightlines, such as the type of the galaxy that probably hosts the absorbing cloud in its environment (Col. 5), the proper absorber-galaxy distance (“impact parameter”; Col. 6), and the galaxy luminosity (Col. 7). References are given in the last column (see also Zwaan et al. 2005). The total neutral gas column density for the associated H i Ly α absorption is also listed (Col. 3), allowing us to distinguish between damped Lyman α absorbers (DLAs; log N(H i) > 20.3), sub-damped Lyman α absorbers (sub-DLAs; 19.2 < log N(H i) ≤ 20.3) and Lyman-limit systems (LLS; 17.2 ≤ log N(H i) ≤ 19.2), following the usual H i Ly α absorber classification. Four out of the seven Ca ii absorbers are DLAs, two are sub-DLAs, and there is one LLS. The derived impact parameters are typically small (d < 8 kpc for four sightlines out of seven, for which information on d is available). Note, however, that neither the H i column density range nor the distribution of impact parameters for the absorbers listed in Table 3 are statistically representative for intervening Ca ii absorbers. The data for five out of the seven systems are not taken from a random absorber sample, but come from targeted observations of DLAs and sub-DLAS at low redshift. Thus, we expect that Table 3 is strongly biased towards high column density systems and low impact parameters. Still, the supplementary information listed in Table 3 provides important information on the physical conditions in these systems, as will be discussed below.
 |
Fig. 9 Left panel: relation between Ca ii and H i column densities for seven Ca ii absorption systems. The solid line indicates the best fit through the data points, the dashed line indicates the relation found for Ca ii and H i in the Milky Way by Wakker & Mathis (2000). Right panel: relation between log (Ca ii/H i), scaled to the solar (Ca/H) ratio, and log N(H i) for the same absorbers. The solid line again indicates the best fit through the data points, while the dashed line shows the trend found in the Milky Way (Wakker & Mathis 2000). |
In Fig. 9 we show the relation between log N(Ca ii) and log N(H i) for these seven systems (left panel), as well as the relation between the log (Ca ii/H i) = log (N(Ca ii)/N(H i)) scaled to the solar (Ca/H) ratio and log N(H i) (right panel). Despite the scatter there is a clear correlation between the Ca ii column density and the H i column density, which can be fitted as ![Mathematical equation: \begin{equation} {\rm log}\,N({\rm Ca\,II})=8.415+0.193\,[{\rm log}\,N({\rm H\,I})], \end{equation}](/articles/aa/full_html/2011/04/aa15566-10/aa15566-10-eq209.png) (4)in Fig. 9 (left panel) indicated as solid line. The slope of this relation agrees remarkably well with the slope found for the Ca ii/H i ratio in Milky Way disk and halo clouds (Wakker & Mathis 2000), but the Milky Way data points are systematically offset in either the x or y direction. Most likely, this offset is in y and is caused by an above average dust-to-gas ratio in the Milky Way, compared to intervening absorbers. This would cause a higher depletion of Ca into dust grains, so that the measured gas phase Ca column densities in the Milky Way absorbers would be systematically lower. The observed relation indicates that it needs an increase of about five orders of magnitude in the total neutral gas column density (from 1017 to 1022 cm-2) to lift the gas phase Ca ii column density by one order of magnitude (from 1011.7 to 1012.7 cm-2). As a consequence, the Ca ii/H i ratio decreases strongly with increasing H i column density (Fig. 9, right panel). This tight relation in our data can be approximated by the fit
(4)in Fig. 9 (left panel) indicated as solid line. The slope of this relation agrees remarkably well with the slope found for the Ca ii/H i ratio in Milky Way disk and halo clouds (Wakker & Mathis 2000), but the Milky Way data points are systematically offset in either the x or y direction. Most likely, this offset is in y and is caused by an above average dust-to-gas ratio in the Milky Way, compared to intervening absorbers. This would cause a higher depletion of Ca into dust grains, so that the measured gas phase Ca column densities in the Milky Way absorbers would be systematically lower. The observed relation indicates that it needs an increase of about five orders of magnitude in the total neutral gas column density (from 1017 to 1022 cm-2) to lift the gas phase Ca ii column density by one order of magnitude (from 1011.7 to 1012.7 cm-2). As a consequence, the Ca ii/H i ratio decreases strongly with increasing H i column density (Fig. 9, right panel). This tight relation in our data can be approximated by the fit ![Mathematical equation: \begin{equation} {\rm log\,(Ca\,II/H\,I)}=8.374-0.807\,[{\rm log}\,N({\rm H\,I})], \end{equation}](/articles/aa/full_html/2011/04/aa15566-10/aa15566-10-eq216.png) (5)as shown as solid line in the right panel of Fig. 9. The observed decline of Ca ii/H i over three orders of magnitude as a function of N(H i) cannot be primarily caused by a Ca/H abundance gradient among the absorbers, but is instead a clear sign of a column-density-dependent dust depletion of Ca in the gas. This effect is well known from observations of Ca ii and other ions in the interstellar gas in the Milky Way. Indeed, the Ca ii/H i vs. N(H i) relation from Milky Way disk and halo observations (Wakker & Mathis 2000; dashed line) reflects exactly the trend that is seen in our intervening Ca ii absorbers (albeit the small relative offset; see above). As we will discuss in Sect. 4.2, additional evidence for dust depletion in the Ca ii absorbers comes from the observed Na i/Ca ii ratios.
(5)as shown as solid line in the right panel of Fig. 9. The observed decline of Ca ii/H i over three orders of magnitude as a function of N(H i) cannot be primarily caused by a Ca/H abundance gradient among the absorbers, but is instead a clear sign of a column-density-dependent dust depletion of Ca in the gas. This effect is well known from observations of Ca ii and other ions in the interstellar gas in the Milky Way. Indeed, the Ca ii/H i vs. N(H i) relation from Milky Way disk and halo observations (Wakker & Mathis 2000; dashed line) reflects exactly the trend that is seen in our intervening Ca ii absorbers (albeit the small relative offset; see above). As we will discuss in Sect. 4.2, additional evidence for dust depletion in the Ca ii absorbers comes from the observed Na i/Ca ii ratios.
4. Nature and origin of intervening Ca ii absorbers
4.1. Ca ii absorbers as HVC analogs
Using Eq. (4), together with the observed Ca ii column densities (and their uncertainties), one can calculate that 3 − 5 of the 10 unbiased Ca ii absorbers would have H i column densities in the DLA range (log N(H i) ≥ 20.3) , so that an indirect estimate for the DLA number density at z ≤ 0.5 in our data is (DLA) = 0.035 − 0.058. This agrees well with direct estimates for the DLA number density at low redshift ((DLA) = 0.045; Zwaan et al. 2005). With  (Sect. 3.2), Ca ii absorbers with log N(Ca ii) ≥ 11.65 outnumber DLAs at low z by a factor of 2−3. This implies that Ca ii absorbers have a higher absorption cross section than DLAs, i.e., they trace neutral gas that spans a larger column density range and that is spatially more extended than DLAs. Since DLAs at low z are believed to arise in the inner regions of galaxies (i.e., in their interstellar media), we conclude that Ca ii absorbers, which trace gas below the DLA limit (log N(H i) < 20.3), arise predominantly in the outer, more extended regions of these galaxies, i.e., in their gaseous halos.
Strong observational support for this scenario comes from the distribution of the H i 21 cm emission in the Milky Way disk and halo. The 21 cm emission measured in the disk from the position of the sun indicates a neutral gas column density range that would cause the disk to appear as a DLA if observed from outside. In contrast, the majority of the neutral gas clouds in the Milky Way halo with vertical distances > 1 kpc from the Galactic plane (this would include probably all HVCs and some of the IVCs; see Wakker 2001; Richter 2006) have H i column densities log N(H i) < 20.3 and would therefore be classified as sub-DLAs and LLSs if seen as intervening absorbers. Moreover, Ca ii absorption is frequently detected in the Galactic IVCs and HVCs at column densities that are very similar to the ones derived by us for the intervening Ca ii absorber population (Richter et al. 2005; Ben Bekhti et al. 2008; Richter et al. 2009; Wakker et al. 2007, 2008).
Based on these arguments, we are led to suggest that more than half of the Ca ii absorbers in our sample trace neutral and partly ionized gas clouds in the halos and circumgalactic environment of galaxies and thus represent distant HVC analogs.
4.2. The Na i/Ca ii ratio and dust depletion
For the eleven Ca ii absorbers, for which information on Na i absorption is available (Sect. 3.6), we find a wide range in Na i/Ca ii ratios (or upper limits) from log (Na i/Ca ii) = −1.36 to log (Na i/Ca ii) = + 0.66, as listed in Table 4. In the Milky Way, these ratios are typical of the diffuse, warm neutral medium (WNM; T = 102 − 104 K; nH ≤ 10 cm-3), where Ca ii and Na i often are not the dominant ionization states, but serve as trace species (see, e.g., Crawford 1992; Welty et al. 1996). For comparison, the Na i/Ca ii ratios that are typically found in the Milky Way in the more dense, cold neutral medium (CNM; T < 102 K; nH > 10 cm-3) lie in the range log (Na i/Ca ii) = 1.0 − 2.5. The Na i/Ca ii ratios are higher in the CNM than in the WNM because of the enhanced dust depletion of Ca in the CNM. It is known that the WNM has a larger volume- and area-filling factor than the CNM and the molecular gas phase in galaxies and DLAs (Hirashita et al. 2003). The observed range in the Na i/Ca ii ratios in the intervening Ca ii absorbers thus reflects the large absorption cross section of the WNM in the inner and outer regions of galaxies compared with the small cross section of the CNM and and the molecular gas.
To learn more about the physical properties and origin of the intervening Ca ii absorbers we analyse the implications of their measured Na i/Ca ii ratios in more detail. We start by a comparison with the physical conditions in the inner regions of galaxies (e.g., in gaseous disks), where the gas densities and dust abundances are expected to be the highest and where the neutral hydrogen column densities are comparable to those in DLAs (i.e., log N(H i) ≥ 20.3). Under these conditions, the observed Na i/Ca ii ratio is determined by the gas-phase abundances of Na and Ca and the photoionization balance of these ions (i.e., ignoring collisional ionization). The ratio therefore depends on the local interstellar radiation field, the optical depth in the cloud (often expressed by AV), the local electron density, and the dust depletion of both elements. For the WNM, where the electron densities are low (ne ≤ 0.05 cm-3, typically), it has been derived from ionization models that the Na i/Ca ii ratio in dust-free gas is expected to be nearly constant at log (Na i/Ca ii) ≈ −1.6 (Crawford 1992; Welty et al. 1996; Asplund et al. 2005). Consequently, the large range in the observed Na i/Ca ii ratios in the WNM in the Milky Way (log (Na i/Ca ii) ≈ −1 to + 1; e.g., Welty et al. 1996) is caused predominantly by the local differences in the Ca dust depletion, but not by ionization effects.
Because some of the intervening Ca ii absorbers appear to arise in the inner regions of galaxies with physical conditions that may be comparable to those in the Milky Way disk, we use below the relations discussed above to provide a rough estimate for the Ca depletion, δCa, in these systems, where we define log δCa = log (Ca/H)gas phase − log (Ca/H)total. If we adopt log (Na i/Ca ii) = −1.6 for warm neutral gas without dust depletion, we can use the measured Na i/Ca ii ratios in the absorbers to estimate δCa,disk in the way log δCa,disk = −log (Na i/Ca ii) − 1.6, assuming that Na is not depleted. From this, we obtain values for log δCa,disk (or lower limits) in the range − 0.24 to − 2.26, as listed in the fourth column of Table 4. These values indicate a weak to moderate dust depletion of calcium in these absorbers. The large scatter in δCa most likely reflects the differences in the local dust abundances in the absorbers and the large range in physical conditions that are believed to balance the formation and destruction of interstellar dust grains.
Note that the values for log δCa listed in Table 4 would be further decreased (by log δNa), if Na is depleted, too. For the three systems towards J121509+330955, J215501-092224, and J044117-431343, for which there is information on Ca ii, Na i, and H i, the estimated values for log δCa are generally higher than the values for log (Ca ii/H i) + 5.69, as shown in Fig. 9. This is not surprising, however, because the latter relation depends not only on the dust depletion of Ca in the gas, but also on the metallicity of the absorbers, which are likely to be sub-solar (i.e., log (Ca/H) < −5.69).
Na i/Ca ii ratios and Ca depletion.
4.3. Cloudy modelling
For gas that resides in the inner regions of galaxies and that has high neutral gas column densities, a more detailed ionization modelling of the ions seen in absorption is not meaningful because of the mostly unknown local physical conditions and the unknown spatial distribution of the gas along the line of sight. Since a large fraction of intervening Ca ii absorbers are expected to represent HVC analogs (see Sect. 4.1), however, it is useful to investigate ion ratios expected for isolated interstellar gas clouds in the halos and circumgalactic environment of galaxies that are photoionized by the ambient extragalactic UV radiation field (see also Richter et al. 2009). We therefore modelled the ionization conditions of sub-DLAs and LLS using the photoionization code Cloudy (v96; Ferland et al. 1998). The model absorbers (that are assumed to be optically thin in H i) are treated as plane-parallel slabs, with fixed neutral gas column densities and zero dust depletion, which are exposed to the UV background radiation. For our study, we considered a grid of Cloudy models with absorbers at z = 0.1,0.3,0.5 with log N(H i) = 17.0,17.5,18.0,18.5,19.0,19.5 and metallicities of 0.1,0.5,1.0 solar.
For our modelling we focused on the relation between the column densities of H i, H ii, Ca i, Ca ii, Ca iii, Na i, and Mg ii as a function of the ionization parameter U, the ratio between the ionizing photon density and the total particle density (i.e., U = nγ/nH). For an assumed ionizing radiation field one can calculate nγ and thus can relate U to the gas density nH. The redshift-dependent UV background was modelled based on the results by Haardt & Madau (2001), with solar reference abundances from Asplund et al. (2005).
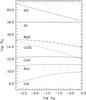 |
Fig. 10 Cloudy model for an example of an absorber at z = 0.3 with a neutral hydrogen column density of log N(H i) = 18.0 and solar calcium and sodium abundances. Shown are the expected ion column densities of the ions H i, H ii, Ca ii, Mg ii, and Na i as a function of the gas density. |
In Fig. 10 we show as an example the Cloudy model for an absorber at z = 0.3 with a neutral hydrogen column density of log N(H i) = 18.0, and solar calcium and sodium abundances. In the density range considered (−2.8 ≤ log nH ≤ 0.0), hydrogen is predominantly ionized in these model absorbers (this is observed also in the Milky Way HVCs; e.g., Tripp et al. 2003). Because we fix N(H i) in our calculations, the column density of ionized hydrogen (N(H ii)) and the total mass of a model absorber increases with decreasing gas density, nH, because of the increasing hydrogen ionization fraction. All our Cloudy models show that both the Ca ii and the Na i column density are nearly constant over the plotted volume density range and thus both ions follow H i one-to-one. In the model shown in Fig. 10 the column density ratios are log (Ca ii/H i) ≈ −5.7 (~ (Ca/H)⊙) and log (Na i/H i) ≈ −7.0 (~0.04 (Na/H)⊙). The underabundance of Na i is explained by the fact that most of the Na is ionized to Na ii at these relatively low gas densities. The predicted Na i/Ca ii column density ratio is log (Na i/Ca ii) ≈ −1.2, thus slightly higher than the ratio derived for warm, dust-free neutral gas clouds (WNM) in the Milky Way disk (see previous subsection). In analogy to what has been derived for the Milky Way disk model, we estimate for the halo model the depletion of Ca using log δCa,halo = −log (Na i/Ca ii) − 1.2, assuming that Na is not depleted. The derived values for log δCa,halo range between 0 and −1.86 (Table 4, fifth column).
From our Cloudy modelling it follows that Ca ii absorbers with log N(Ca ii) ≥ 11.5 represent reliable tracers for neutral and partly ionized gas clouds with H i column densities log N(H i) ≥ 17.4. However, whether or not Ca ii is actually detected in an absorber depends not only on the neutral gas column density and the Ca abundance, but also on the level of dust depletion of Ca. For a dusty multi-phase absorber that has both predominantly neutral and predominantly ionized regions this implies that Ca ii absorption is detectable only in those regions, where the metallicity and the neutral gas column density is high enough to compensate for the local dust depletion effect. Compared to Ca, dust depletion is less important for Na, in particular in diffuse gas (Crawford 1992). Therefore, the presence or absence of Na i absorption in intervening Ca ii systems depends predominantly on the total neutral gas column density in the absorbers. From our Cloudy modelling we find that in clouds with sub-solar abundances, Na i absorption with log N(Na i) ≥ 11.5 is detectable only in systems with log N(H i) > 18.5. The presence or absence of Na i absorption in Ca ii absorbers thus discriminates between high-column-density H i clouds (DLAs and sub-DLAs) and low-column-density H i clouds (LLS), respectively. This explains why only half of the Ca ii absorbers show associated Na i absorption.
As can be seen in Fig. 10, the Mg ii column density is, in contrast to Ca ii and Na i, not constant over the plotted density range, but increases by about one order of magnitude with decreasing volume density and increasing total gas column density, N(H i+H ii). Thus, Mg ii traces both neutral and ionized gas. This, together with the higher cosmic abundance and the less severe dust depletion of Mg, compared to Ca, makes the Mg ii ion more sensitive to the overall gas distribution in the absorbers. This explains why the Mg ii absorption is more complex and more extended than that of Ca ii (see Sect. 3.6).
4.4. Constraints on the gas densities
From the Milky Way it is known that absorption components with large Na i/Ca ii ratios represent regions that have relatively high gas densities. As demonstrated above, this effect is not because of the photoionization balance between Na i and Ca ii in disk and halo clouds, but is a result of the density-dependend dust depletion of Ca. A larger dust depletion of Ca in high-density environments is expected because of the density-dependent Ca adsorption onto grain surfaces (Barlow 1978). For the Milky Way disk, Crawford (1992) found that for log (Na i/Ca ii) ~ 1 a typical gas density is nH ≈ 10 cm-3. In the intervening Ca ii absorbers we always find log (Na i/Ca ii) < 0.7 (and in most cases log (Na i/Ca ii) < 0; see Table 4). As we have no further direct information on the gas density, we regard nH = 10 cm-3 as a realistic upper limit for the gas densitiy in the Ca ii absorbers detected in our survey.
An estimate for the lower limit of nH in the Ca ii absorbers can be provided based on results from ionization modelling of local, low-density Ca ii absorbing environments, such as the HVCs in the Milky Way halo. Ca ii absorption is frequently observed in the Galactic H i 21 cm IVCs and HVCs in the Milky Way (e.g., West et al. 1985; D’Odorico et al. 1989; Wakker 2001; Ben Bekhti et al. 2008, 2009). Indeed, this ion plays a key role in determining the distances of Galactic HVCs and IVCs (Wakker et al. 2007, 2008; Thom et al. 2008). Also, below the detection threshold of H i 21 cm all-sky surveys, Ca ii absorption is found in the halo in low column density gas fragments (Richter et al. 2005; Ben Bekhti et al. 2009). Richter et al. (2009) detected Ca ii absorption, along with other low ions (e.g., O i and Si ii), in two components of a LLS (=low column density HVC) in the Milky Way halo towards the QSO PHL 1811, at a neutral gas column density of only log N(H i) ≈ 17. From detailed ionization modelling, a lower limit for the density of nH ≥ 0.3 cm-3 was derived for one of those absorption components, and a limit of nH ≥ 0.05 cm-3 was obtained for the other component. A value of nH ≈ 0.05 cm-3 probably also represents a realistic lower limit for the gas density in intervening Ca ii absorbers.
4.5. The size of neutral gas halos around galaxies
Assuming that intervening Ca ii absorption arises in both the disks and extended gaseous halos of galaxies, we can use the relation  (6)between the geometrical cross section of the absorbers and the absorber number density per unit redshift to investigate the spatial extent of galaxies and their gaseous halos (e.g., Kacprzak et al. 2008). In the above equation, ng is the space density of galaxies, Rh is the radius of the Ca ii absorbing region in a galaxy (i.e., disk+halo), fc,Ca II ≤ 1 is the covering fraction of Ca ii absorbing gas above a given column density limit, and H(z) = H0 (Ωm (1 + z)3 + ΩΛ)1/2 is the Hubble parameter. The space density of galaxies above a given luminosity threshold Lmin can be obtained from the Schechter galaxy luminosity function. For our further considerations we assume ng = 0.0107 Mpc-3 for Lmin = 0.05 L ⋆ and ⟨ z ⟩ ≈ 0.35, based on the results of Faber et al. (2007).
Unfortunately, the covering fraction of Ca ii in galaxy halos is not well constrained. While Ben Bekhti et al. (2008) have found fc,Ca II ≈ 0.22 for log N(Ca ii) ≥ 11.65 for the Milky Way halo based on the same UVES optical data that we use in this paper, this result cannot be directly adopted here because of the different observing perspectives (inside view vs. outside view). Modelling the radial distribution of Ca ii absorbers in galaxy halos based on all available observational results clearly is beyond the scope of this study. This issue will be addressed in detail in a subsequent paper, but here we present some simple considerations about the absorption cross section of Ca ii in galaxies.
First, let us assume that all galaxies have neutral gas disks with radius Rd that represent DLAs and that the disks are spherically surrounded by a population of neutral gas clouds (sub-DLAs and LLS) in a halo with radius Rh. Second, we assume the simplest case of gaseous disks with a Ca ii covering fraction of fc,Ca II = 1, and with a total absorption cross section of  when seen face-on and σd = 0 when seen edge-on. For the halo cloud population we assume that the volume filling factor of neutral gas in the halo is constant, so that the observed covering fraction scales directly with the absorption pathlength through the halo. Moreover, we fix the Ca ii covering fraction for log N(Ca ii) ≥ 11.65 along the pathlength Rh (inside view) to 0.22, based on the results of Ben Bekhti et al. (2008) for the Milky Way halo. Because the mean pathlength through a spherical halo from outside is ~1.23 times the radius of that sphere, we assume that the mean Ca ii covering fraction in a galaxy halo (for log N(Ca ii) ≥ 11.65) from an external vantage point is fc,Ca II = 1.23 × 0.22 ≈ 0.27. The total absorption cross section of the neutral halo gas then is
  . Note that we neglect any luminosity scaling for the galaxy sizes at this point. The next step in our galaxy halo model is to invert Eq. (5) and insert the above value for ng, together with H(z = 0.35), (Ca ii) = 0.117, and (DLA) = 0.045 and iteratively solve for Rh, Rd, and ⟨fc,Ca II⟩. If we do so, we obtain Rh = 55 kpc, Rd = 20 kpc and ⟨fc,Ca II⟩ = 0.33. Thus, if all galaxies with L ≥ 0.05 L ⋆ are spherically surrounded by a population of Ca ii absorbing neutral/partly ionized gas clouds (i.e., HVCs), e.g., as part of their accretion and/or star-formation activities, and if the mean Ca ii covering fraction of this gas is ~0.33, then the characteristic radial extent of such a HVC population is RHVC ≈ 55 kpc.
For comparison, the most distant known HVC in the halo of the Milky Way is the Magellanic Stream (MS), which has a distance of ~50 kpc from the Galaxy (Gardiner & Nogudi 1996). The MS is a tidal stream that is being accreted by the Milky Way (e.g., Fox et al. 2010). For M31, Thilker et al. (2004) have shown that the population of H i 21cm halo-clouds around Andromeda extends to radii of ~60 kpc. For Mg ii, Kacprzak et al. (2008) estimated a halo size of Rh ~ 91 kpc for L ≥ 0.05 L ⋆ galaxies at z = 0.5, assuming fc,Mg II ~ 0.5 and no luminosity scaling of Rh. The larger halo radius for Mg ii (and the higher covering fraction) reflects the higher sensitivity of Mg ii absorption for low column density neutral and ionized gas in the outskirts of galaxies.
It is important to note that our approach to constrain the sizes of neutral gas halos of galaxies in the local Universe from the number density of intervening Ca ii absorbers is based on very simple assumptions. In particular, the covering fraction of neutral gas in the halos of galaxies may not be constant, but may decrease with increasing radius (as seen in M31; Thilker et al. 2004). Nonetheless, our simplified estimate for RHVC delivers a very plausible result, which is consistent with what we know about the distribution of neutral gas around galaxies in the local Universe (e.g., Sancisi et al. 2008).
4.6. Intervening Ca ii and the H i CDDF
In Sect. 3.4 we investigated the relation between Ca ii and H i in individual systems. We will now discuss the frequency of Ca ii systems in a more cosmological context, i.e., by relating the Ca ii number density with the CDDF of intervening H i absorbers. Because the H i CDDF for 16 ≤ log N (H i) ≤ 21 is not well constrained for z ≤ 0.5 (see Lehner et al. 2007, and references therein), we adopt a “standard” CDDF for intervening H i absorbers with with β = 1.5, so that f(N) ∝ N-1.5 (e.g., Kim et al. 2002). Let us first consider that every intervening Ca ii absorber traces a corresponding H i system. For DLAs with log N(H i) ≥ 20.3 one finds  at z ≤ 0.5 (e.g., Zwaan et al. 2005). An absorber number density of instead corresponds to all absorbers with log N(H i) ≥ 19.7 in the H i CDDF (as derived from integrating the H i CDDF over the appropriate range). From Eq. (4) and Fig. 9 we find that the mean (Ca ii/H i) ratio is ~2.4 dex below the solar value for absorbers in the range 19.7 ≤ log N(H i) ≤ 20.5 (i.e., those absorbers that dominate the number density, (Ca ii)). This indicates, along with the solar Ca abundance of (Ca/H)⊙ = −5.69, that H i absorbers with log N(H i) ≥ 19.7 should have (on average) Ca ii column densities of log N(Ca ii) ≥ 11.6.
This expectation value excellently agrees with our completeness limit of log N(Ca ii) = 11.65, for which (Ca ii) was derived. This shows that – if one takes dust depletion of Ca into account – the observed Ca ii number density of for log N(Ca ii) > 11.65 agrees very well with the number of metal enriched sub-DLAs and DLAs expected from the H i CDDF. Note that this correspondence can be interpreted only in a statistical sense. There are individual systems with log N(H i) ≥ 19.7 and log N(Ca ii) < 11.6 as well as systems with log N(H i) < 19.7 and log N(Ca ii) ≥ 11.6 (see Tables 2 and 3).
5. Comparison with previous Ca ii studies
While Ca ii was among the first ions detected in intervening absorbers in QSO spectra (see Blades 1988, for a review), there are only a few studies that have used this ion in a systematic manner to investigate QSO absorption line systems. This is because strong, intervening Ca ii absorption is apparently very rare and the detection of the more frequent weak Ca ii absorbers requires high S/N and high spectral resolution. Bowen et al. (1991) have studied intervening Ca ii absorption in the halos of nine low-redshift (z < 0.2) galaxies based on intermediate resolution optical spectra obtained with various different instruments. The 2σ equivalent width detection limits in the λ3934 line of those data range between 38 and 164 mÅ. While all nine sightlines pass within 45 h-1 kpc of the galaxies, only one detection is reported. Including previous results on intervening Ca ii absorption along QSO sightlines, Bowen et al. concluded that Ca ii absorption in galaxy halos is relatively weak and the distribution of Ca ii around galaxies is inhomogeneous with covering fractions much smaller than unity for the equivalent width limit reached in their survey. Our results confirm this scenario. From our data we estimate that the covering fraction of Ca ii absorption in the halos of galaxies with Wr > 70 mÅ in the λ3934 line, is ~ 1/9, which agrees very well with the detection rate reported by Bowen et al. (1991).
The more recent systematic studies of intervening Ca ii absorption at low and intermediate redshift by Wild et al. (2006, 2007), Zych et al. (2007, 2009), and Nestor et al. (2008) have concentrated on the frequency and nature of strong Ca ii absorption systems with Wr,3934 > 200 mÅ, motivated by the detection of these systems in the very large sample (~14 500) of low resolution spectra from the Sloan Digital Sky Survey (SDSS). From these studies it was concluded that strong Ca ii absorbers represent the subset of DLAs with a particularly high dust content. From the SDDS data, Wild et al. (2006) have derived a number density of  for strong Ca ii systems with Wr,3934 ≥ 500 mÅ at ⟨zabs⟩ = 0.95, which is ~ 20–30 percent of the number density of DLAs at that redshift. In our Ca ii absorber sample there is only one system (in the unbiased sample) that has Wr,3934 ≥ 500 mÅ (see Table 2). Because all 304 spectra in our original QSO sample have a S/N high enough to detect Ca ii absorption at this level (see Sect. 2.1), the total redshift path available for detecting strong Ca ii absorption in our data is Δz = 100.60. Thus,
  for Wr,3934 ≥ 500 mÅ and ⟨zabs⟩ = 0.35. This is ~ 20 percent of the number density of DLAs at low redshift (Zwaan et al. 2005), and thus similar to the results for ⟨zabs⟩ = 0.95 by Wild et al. (2006). Therefore, the relative cross section of strong Ca ii systems compared with DLAs has not changed from z = 1 to z = 0.3.
6. Summary
We presented a systematic study of intervening Ca ii absorption in the redshift range z = 0.0 − 0.5, along 304 QSO sightlines with a total redshift path of Δz ≈ 100, using optical high-resolution spectra obtained with VLT/UVES. The main results can be summarized as follows:
-
(1)
We detect 23 intervening Ca ii absorbers atredshifts z = 0.00396 − 0.47439 in our data, at rest frame equivalent widthsWr,3934 = 15 − 799 mÅ and columndensities log N(Ca ii) = 11.25 − 13.04. We determine a bias-correctednumber density of Ca ii absorbers per unitredshift of
(Ca ii) = 0.117 ± 0.044 for absorbers withlog N(Ca ii) > 11.65. Ca ii absorbers abovethis column density level outnumber damped Lyman α absorbers(DLAs) at low redshift by a factor of two to three. -
(2)
From ionization modelling we conclude that intervening Ca ii absorbers, with log N(Ca ii) > 11.5, trace neutral and partly ionized gas at H i column densities log N(H i) > 17.4. Probably more than half of the detected Ca ii absorbers arise in gas clouds at H i column densities below the DLA limit (log N(H i) ≤ 20.3). These absorbers therefore mimic the properties of the H i 21cm high-velocity clouds (HVCs) in the halo of the Milky Way. This suggests, along with the large absorption cross section of Ca ii absorbers compared with DLAs, that most of the weak Ca ii systems represent HVC analogs in the halos of intervening galaxies.
-
(3)
The subcomponent structure of intervening Ca ii absorbers is relatively simple, typically with ≤ 3 absorption components per system. Ca ii absorption components follow a well defined column density distribution function (CDDF), f(N) = C N − β, with β = 1.68 ± 0.20. This CDDF is mildly steeper than what is typically found for other ions (e.g., Mg ii), indicating the effect of enhanced depletion of Ca into dust grains in high column density absorbers.
-
(4)
Almost all (18/19) Ca ii systems, for which information on Mg ii is available, show associated strong Mg ii absorption with Mg ii rest frame equivalent widths Wr,2796 ≥ 300 mÅ. While the Ca ii absorption generally is aligned with the strongest Mg ii absorption component, the velocity extent of the Mg ii absorption is substantially larger than that of Ca ii. We conclude that the absorbers represent extended, multicomponent and multiphase gaseous structures, for which the Ca ii absorption is detectable only in the regions with the highest neutral gas column densities.
-
(5)
For seven of the Ca ii absorbers we have supplementary information on the H i column density from previous studies. The calcium-to-hydrogen ratio (Ca ii/H i) decreases strongly with increasing H i column density (from log (Ca ii/H i) = −6.3 at log N(H i) = 18 to log (Ca ii/H i) = −9.3 at log N(H i) = 22). Five Ca ii absorbers are detected in Na i (detection rate is 45 percent) and the observed Na i/Ca ii ratios lie in the range 0.2 − 4.6. These numbers indicate moreover that Ca ii absorbers contain substantial amounts of dust and that the depletion of Ca into dust grains increases with increasing gas column density. This trend mimics the trend seen in the Milky Way disk and halo gas.
-
(6)
Taking into account the observed Ca ii-H i relation, the number density of Ca ii absorbers of
, for log N(Ca ii) > 11.65, matches the expected value for metal- and dust-enriched sub-DLAs and DLAs estimated from the H i CDDF. These results support our original idea that intervening Ca ii absorbers represent excellent tracers of metal-enriched neutral gas in the inner and outer regions of galaxies. -
(7)
From the observed number density of Ca ii absorbers per unit redshift of
(Ca ii) = 0.117, we estimate the characteristic radial extent, RHVC, of (partly) neutral gas clouds (HVCs) around low-redshift galaxies with log N(H i) ≥ 17.4. Considering all galaxies with L ≥ 0.05L ⋆ , and assuming that the mean (projected) Ca ii covering fraction inside and outside of galaxies is ⟨fc,CaII⟩ = 0.33 (as estimated from Milky Way Ca ii absorption statistics), we derive RHVC ≈ 55 kpc.
The study presented in this paper demonstrates that (weak) intervening Ca ii absorbers provide important information on the neutral gas extent of galaxies. More detailed studies of this absorber population thus might be useful to investigate the circulation processes of neutral gas in galaxy halos that characterize the ongoing formation and evolution of galaxies at low redshift due to galaxy merging, gas accretion from the IGM, and outflows.
For a better understanding of these processes and to quantify the gas accretion rate of galaxies in the local Universe it will be particularly important to investigate in detail the radial distribution of neutral and ionized gas around galaxies. This can be done by combining absorption-line studies in the optical and in the UV with high-resolution H i 21cm observations of nearby galaxies. Indeed, with the advent of poweful optical multiaperture spectrographs at ground based 8m-class telescopes, a new sensitive UV spectrograph installed on HST (Cosmic Origins Spectrograph; COS), and new sensitive H i 21cm surveys (e.g., the Effelsberg-Bonn-H i-Survey; EBHIS), future multiwavelength studies are expected to provide important new details on the complex interplay between galaxies and their circumgalactic gaseous environment.
Online material
Appendix A: Supplementrary tables and figures
Results from Voigt-profile fitting of intervening Ca ii absorbers.
List of additional Ca ii candidate systems.
 |
Fig. A.1 Velocity profiles (absorber rest-frame) of Ca ii and associated Na i, Mg ii, and Fe ii absorption in various intervening Ca ii absorption systems. Quasar names and absorption redshifts are indicated at the top of each panel. |
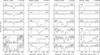 |
Fig. A.1 continued. |
 |
Fig. A.1 continued. |
 |
Fig. A.1 continued. |
 |
Fig. A.1 continued. |
Complete list of QSOs in our data sample with mean S/N and Ca ii redshift path (dz).
32 mÅ corresond to our completeness level of log N = 11.65 for optically thin Ca ii absorption in an unresolved, single-component absorption line.
Acknowledgments
P.R. acknowledges financial support by the German Deutsche Forschungsgemeinschaft, DFG, through grant Ri 1124/5-1. J.C.C. is grateful for support from NASA under grant NAG5-6399 NNG04GE73G.
References
- Adelberger, K. L., Steidel, C. C., Shapley, A. E., & Pettini, M. 2003, ApJ, 584, 45 [NASA ADS] [CrossRef] [Google Scholar]
- Asplund, M., Grevesse, N., & Sauval, A. J. 2005, in Cosmic Abundances as Records of Stellar Evolution and Nucleosynthesis, ed. T. G. Barnes, III, & F. N. Bash, ASP Conf. Ser., 336, 25 [Google Scholar]
- Barlow, M. J. 1978, MNRAS, 183, 417 [NASA ADS] [CrossRef] [Google Scholar]
- Ben Bekhti, N., Richter, P., Westmeier, T., & Murphy, M. T. 2008, A&A, 487, 583 [NASA ADS] [CrossRef] [EDP Sciences] [Google Scholar]
- Ben Bekhti, N., Richter, P., Winkel, B., Kenn, F., & Westmeier, T. 2009, A&A, 503, 483 [NASA ADS] [CrossRef] [EDP Sciences] [Google Scholar]
- Bergeron, J., & Boissé, P. 1991, A&A, 243, 344 [NASA ADS] [Google Scholar]
- Blades, J. C. 1988, in QSO absorption lines: Probing the universe, 147, ed. Blades, J.C., Turnshek, D., & Norman, C. A., Space Telescope Science Institute Symp. Ser. No. 2 (Cambridge: Cambridge University Press) [Google Scholar]
- Bland-Hawthorn, J. 2009, in The Galaxy Disk in Cosmological Context, IAU Symp., 254, 241 [NASA ADS] [Google Scholar]
- Bowen, D. V. 1991, MNRAS, 251, 649 [NASA ADS] [Google Scholar]
- Bowen, D. V., Pettini, M., Penston, M. V., & Blades, J. C. 1991, MNRAS, 249, 145 [NASA ADS] [CrossRef] [Google Scholar]
- Chen, H., & Lanzetta, K. M. 2003, ApJ, 597, 706 [NASA ADS] [CrossRef] [Google Scholar]
- Chen, H.-W., Kennicutt, R. C., & Rauch, M. 2005, ApJ, 620, 703 [NASA ADS] [CrossRef] [Google Scholar]
- Churchill, C. W., Mellon, R. R., Charlton, J. C., et al. 1999, ApJ, 519, L43 [NASA ADS] [CrossRef] [Google Scholar]
- Churchill, C. W., Vogt, S. S., & Charlton, J. C. 2003, AJ, 125, 98 [NASA ADS] [CrossRef] [Google Scholar]
- Crawford, I. A. 1992, MNRAS, 259, 47 [NASA ADS] [Google Scholar]
- Crighton, N. H. M., Bielby, R., Shanks, T., et al. 2010, MNRAS, in press [arXiv:1006.4385] [Google Scholar]
- D’Odorico, S., di Serego Alighieri, S., Pettini, M., et al. 1989, A&A, 215, 21 [NASA ADS] [Google Scholar]
- Faber, S. M., Willmer, C. N. A., Wolf, C., et al. 2007, ApJ, 665, 265 [NASA ADS] [CrossRef] [Google Scholar]
- Fangano, A. P. M., Ferrara, A., & Richter, P. 2007, MNRAS, 381, 469 [NASA ADS] [CrossRef] [Google Scholar]
- Ferland, G. J., Korista, K. T., Verner, D. A., et al. 1998, PASP, 110, 761 [Google Scholar]
- Fontana, A., & Ballester, P. 1995, ESO Messenger, 80, 37 [Google Scholar]
- Fox, A. J., Wakker, B. P., Smoker, J. V., et al. 2010, ApJ, 718, 1046 [NASA ADS] [CrossRef] [Google Scholar]
- Gardiner, L. T., & Noguchi, M. 1996, MNRAS, 278, 191 [NASA ADS] [CrossRef] [Google Scholar]
- Haardt, F., & Madau, P. 2001, in Clusters of Galaxies in the High Redshift Universe observed in X-rays, ed. D. M. Neumann, & J. T. T. Van, 64 [arXiv:astro-ph/0106018] [Google Scholar]
- Hartmann, J. 1904, ApJ, 19, 268 [Google Scholar]
- Hirashita, H., Ferrara, A., Wada, K., & Richter, P. 2003, MNRAS, 341, L18 [NASA ADS] [CrossRef] [Google Scholar]
- Jenkins, E. B., Bowen, D. V., Tripp, T. M., et al. 2003, AJ, 125, 2824 [NASA ADS] [CrossRef] [Google Scholar]
- Jones, T. M., Misawa, T., Charlton, J. C., Mshar, A. C., & Ferland, G. J. 2010, ApJ, 715, 1497 [NASA ADS] [CrossRef] [Google Scholar]
- Kacprzak, G. G., Churchill, C. W., Steidel, C. C., & Murphy, M. T. 2008, AJ, 135, 922 [NASA ADS] [CrossRef] [Google Scholar]
- Kacprzak, G. G., Churchill, C. W., Ceverino, D., et al. 2010a, ApJ, 711, 533 [NASA ADS] [CrossRef] [Google Scholar]
- Kacprzak, G. G., Murphy, M. T., & Churchill, C. W. 2010b, MNRAS, 406, 445 [NASA ADS] [CrossRef] [Google Scholar]
- Kaufmann, T., Bullock, J. S., Maller, A. H., Fang, T., & Wadsley, J. 2009, MNRAS, 396, 191 [NASA ADS] [CrossRef] [Google Scholar]
- Kim, T.-S., Christiani, S., & D’Odorico, S. 2001, A&A 373, 575 [Google Scholar]
- Lane, W., Smette, A., Briggs, F., et al. 1998, AJ, 116, 26 [NASA ADS] [CrossRef] [Google Scholar]
- Le Brun, V., Bergeron, J., Boisse, P., & Deharveng, J. M. 1997, A&A, 321, 733 [NASA ADS] [Google Scholar]
- Lehner, N., Savage, B. D., Richter, P., et al. 2007, ApJ, 658, 680 [NASA ADS] [CrossRef] [Google Scholar]
- Martin, C. L. 2005, ApJ, 621, 227 [Google Scholar]
- Miller, E. D., Knezek, P. M., & Bregman, J. N. 1999, ApJ, 510, L95 [NASA ADS] [CrossRef] [Google Scholar]
- Morton, D. C. 2003, ApJS, 149, 205 [NASA ADS] [CrossRef] [MathSciNet] [Google Scholar]
- Münch, G. 1952, PASP, 64, 312 [NASA ADS] [CrossRef] [Google Scholar]
- Nestor, D. B., Turnshek, D. A., & Rao, S. 2005, ApJ, 628, 637 [NASA ADS] [CrossRef] [Google Scholar]
- Nestor, D. B., Pettini, M., Hewett, P. C., Rao, S., & Wild, V. 2008, MNRAS, 390, 1670 [NASA ADS] [Google Scholar]
- Petitjean, P., Theodore, B., Smette, A., & Lespine, Y. 1996, A&A, 313, L25 [NASA ADS] [Google Scholar]
- Rao, S. M., Nestor, D. B., Turnshek, D. A., et al. 2003, ApJ, 595, 94 [NASA ADS] [CrossRef] [Google Scholar]
- Richter, P. 2006, Rev. Mod. Astron. 19, 31 [NASA ADS] [CrossRef] [Google Scholar]
- Richter, P., Savage, B. D., Wakker, B. P., et al. 2001, ApJ 549, 281 [NASA ADS] [CrossRef] [Google Scholar]
- Richter, P., Westmeier, T., & Brüns 2005, A&A, 442, L49 [NASA ADS] [CrossRef] [EDP Sciences] [Google Scholar]
- Richter, P., Charlton, J. C., Fangano, A. P. M., Ben Bekhti, N., & Masiero, J. R. 2009, ApJ, 695, 1631 [NASA ADS] [CrossRef] [Google Scholar]
- Sancisi, R., Fraternali, F., Oosterloo, T., & van der Hulst, T. 2008, A&ARv, 15, 189 [NASA ADS] [CrossRef] [EDP Sciences] [Google Scholar]
- Spergel, D. N., Bean, R., Doreé, O., et al. 2007, ApJS, 170, 377 [NASA ADS] [CrossRef] [Google Scholar]
- Steidel, C. C., Kollmeier, J. A., Shapley, A. E., et al. 2002, ApJ, 570, 526 [Google Scholar]
- Thilker, D. A., Braun, R., Walterbos, R. A. M., et al. 2004, ApJ, 601, L39 [NASA ADS] [CrossRef] [Google Scholar]
- Thom, C., Peek, J. E. G., Putman, M. E., et al. 2008, ApJ, 684, 364 [NASA ADS] [CrossRef] [Google Scholar]
- Tripp, T. M., Wakker, B. P., Jenkins, E. B., et al. 2003, AJ, 125, 3122 [NASA ADS] [CrossRef] [Google Scholar]
- Tumlinson, J., Shull, J. M., Rachford, B. L., et al. 2002, ApJ, 566, 857 [NASA ADS] [CrossRef] [Google Scholar]
- Turnshek, D. A., & Rao, S. M. 2002, ApJ, 572, L10 [NASA ADS] [CrossRef] [Google Scholar]
- Wakker, B.P. 2001, ApJS, 136, 463 [NASA ADS] [CrossRef] [Google Scholar]
- Wakker, B. P., & Mathis, J. S. 2000, ApJ, 544, L107 [NASA ADS] [CrossRef] [Google Scholar]
- Wakker, B. P., York, D. G., Howk, J. C., et al. 2007, ApJ, 670, L113 [NASA ADS] [CrossRef] [Google Scholar]
- Wakker, B. P., York, D. G., Wilhelm, R., et al. 2008, ApJ, 672, 298 [NASA ADS] [CrossRef] [Google Scholar]
- Welty, D. E., Morton, D. C., & Hobbs, L. M. 1996, ApJS, 106, 553 [Google Scholar]
- West, K. A., Pettini, M., Penston, M. V., Blades, J. C., & Morton, D. C 1985, MNRAS, 215, 481 [NASA ADS] [Google Scholar]
- Wild, V., Hewett, P. C., & Pettini, M. 2006, MNRAS, 367, 211 [NASA ADS] [CrossRef] [Google Scholar]
- Wild, V., Hewett, P. C., & Pettini, M. 2007, MNRAS, 374, 292 [NASA ADS] [CrossRef] [Google Scholar]
- Zwaan, M. A., van der Hulst, J. M., Briggs, F. H., Verheijen, M. A. W., & Ryan-Weber, E. V. 2005, MNRAS, 364, 1467 [NASA ADS] [CrossRef] [Google Scholar]
- Zych, B. J., Murphy, M. T., Pettini, M., et al. 2007, MNRAS, 376, 673 [NASA ADS] [CrossRef] [Google Scholar]
- Zych, B. J., Murphy, M. T., Hewett, P. C., & Prochaska, J. X. 2009, MNRAS, 392, 1429 [NASA ADS] [CrossRef] [Google Scholar]
All Tables
QSO names, redshifts and ions of 23 intervening Ca ii absorbers at z = 0 − 0.5 detected in our QSO sample.
Column densities, absorption components, velocity widths and equivalent widths for the 23 intervening Ca ii absorbers.
Complete list of QSOs in our data sample with mean S/N and Ca ii redshift path (dz).
All Figures
|
Fig. 1 UVES spectrum of the quasar J215501−092224 in the wavelength range between 4240 and 4300 Å. Weak intervening Ca ii absorption is clearly detected at z = 0.08091 in both Ca ii lines, as indicated by the tick marks. |
| In the text | |
|
Fig. 2 Example for a Voigt-profile fit (red solid line) with four absorption components of the Ca ii absorber at z = 0.23782 towards J095456+174331. |
| In the text | |
|
Fig. 3 Relative redshift coverage for Ca ii absorption for 270 QSO sigthlines, along which intervening Ca ii absorption can be detected at column densities log N(Ca ii) > 11.65. |
| In the text | |
|
Fig. 4 Distribution of (total) logarithmic Ca ii column densities of the 23 absorbers detected in our total QSO sample (left panel) and their redshift distribution (right panel). |
| In the text | |
|
Fig. 5 Distribution of Ca ii λ3934 rest frame equivalent widths for the 23 Ca ii absorbers (left panel) and their velocity width distribution (right panel). |
| In the text | |
|
Fig. 6 Distribution of Doppler parameters (b values) of the 69 Ca ii absorption components in our 23 Ca ii systems (left panel), and number of absorption components per system (right panel), derived from Voigt-profile fitting. |
| In the text | |
|
Fig. 7 Column density distribution function, f(N), for Ca ii components, as derived from our bias-corrected Ca ii absorber sample. Above our completeness limit (log N = 11.65; dotted line), the data fit best to a power law of the form f(N) = C N − β with slope β = 1.68 ± 0.20 (solid line). |
| In the text | |
|
Fig. 8 Comparison beween Ca ii and Mg ii equivalent and velocity widths in the intervening Ca ii absorbers. |
| In the text | |
|
Fig. 9 Left panel: relation between Ca ii and H i column densities for seven Ca ii absorption systems. The solid line indicates the best fit through the data points, the dashed line indicates the relation found for Ca ii and H i in the Milky Way by Wakker & Mathis (2000). Right panel: relation between log (Ca ii/H i), scaled to the solar (Ca/H) ratio, and log N(H i) for the same absorbers. The solid line again indicates the best fit through the data points, while the dashed line shows the trend found in the Milky Way (Wakker & Mathis 2000). |
| In the text | |
|
Fig. 10 Cloudy model for an example of an absorber at z = 0.3 with a neutral hydrogen column density of log N(H i) = 18.0 and solar calcium and sodium abundances. Shown are the expected ion column densities of the ions H i, H ii, Ca ii, Mg ii, and Na i as a function of the gas density. |
| In the text | |
|
Fig. A.1 Velocity profiles (absorber rest-frame) of Ca ii and associated Na i, Mg ii, and Fe ii absorption in various intervening Ca ii absorption systems. Quasar names and absorption redshifts are indicated at the top of each panel. |
| In the text | |
|
Fig. A.1 continued. |
| In the text | |
|
Fig. A.1 continued. |
| In the text | |
|
Fig. A.1 continued. |
| In the text | |
|
Fig. A.1 continued. |
| In the text | |
Current usage metrics show cumulative count of Article Views (full-text article views including HTML views, PDF and ePub downloads, according to the available data) and Abstracts Views on Vision4Press platform.
Data correspond to usage on the plateform after 2015. The current usage metrics is available 48-96 hours after online publication and is updated daily on week days.
Initial download of the metrics may take a while.