Fig. 8
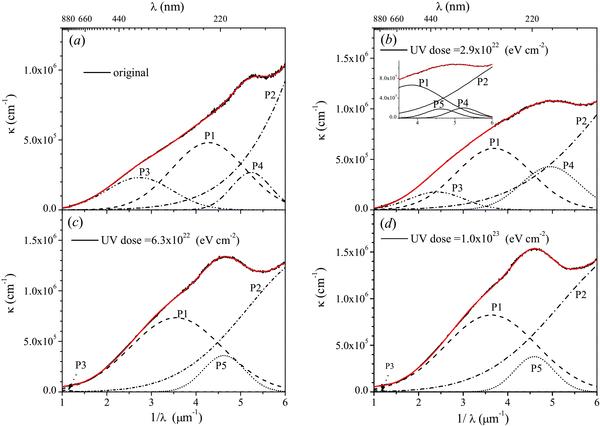
Deconvolution of the absorption spectra of S4; a) for the original spectrum, b), c) and d) for exposures to UV doses of 2.9 × 1022,6.3 × 1022 and 1.0 × 10²³ (eV cm-2), respectively. The inset in the panel b) shows that the rise might be due to the existence of P4 and P5 (small new band at 4.6 μm-1).
Current usage metrics show cumulative count of Article Views (full-text article views including HTML views, PDF and ePub downloads, according to the available data) and Abstracts Views on Vision4Press platform.
Data correspond to usage on the plateform after 2015. The current usage metrics is available 48-96 hours after online publication and is updated daily on week days.
Initial download of the metrics may take a while.