| Issue |
A&A
Volume 528, April 2011
|
|
|---|---|---|
| Article Number | A70 | |
| Number of page(s) | 7 | |
| Section | Galactic structure, stellar clusters and populations | |
| DOI | https://doi.org/10.1051/0004-6361/201015514 | |
| Published online | 03 March 2011 | |
The globular cluster BH 176 revisited
1 Laboratoire d’Astrophysique de
Toulouse-Tarbes, Université de Toulouse, CNRS, 14 avenue E. Belin, 31400
Toulouse,
France
e-mail: davoust@ast.obs-mip.fr
2 Special Astrophysical Observatory,
Russian Academy of Sciences, N.
Arkhyz, KChR,
369167,
Russia
3 Isaac Newton Institute of
Chile, SAO Branch,
Russia
e-mail: sme@sao.ru
4 Instituto de Investigaciones en
Astronomía Teórica y Experimental (IATE), Observatorio Astronómico OAC, Laprida 854, X5000BGR, Córdoba; Consejo Nacional
de Investigaciones Científicas y Técnicas (CONICET),
Avenida Rivadavia 1917,
C1033AAJ, Buenos
Aires, Argentina
e-mail: charly@oac.uncor.edu
Received: 2 August 2010
Accepted: 13 January 2011
Context. First classified as an open cluster, BH 176 lies in a crowded field at low galactic latitude. Later studies have labeled it a transition-type object, a metal-rich globular, or an open cluster, with distance estimates in the range of 15 to 85 kpc, indicating that the true nature of this cluster is rather uncertain.
Aims. Our aim is to determine more precisely the distance to BH 176, and, as a matter of consequence, its metallicity and age.
Methods. We have obtained two color–magnitude diagrams of BH 176, one in the infrared using the 2MASS point-source catalog, the other in the optical using FORS2 VLT archival images. We identified the red giant branch in the infrared and the red giant branch, red giant bump, red horizontal branch, subgiant branch, and main sequence turn-off in the optical, by selecting stars within ~2−3′ from the center of the cluster.
Results. We estimate a distance D ~ 15.1 ± 0.5 kpc from the visual magnitude of the red clump and a metallicity [Fe/H] ~ −0.10 ± 0.1 dex from the magnitudes and colors of the main features in the two color–magnitude diagrams. Fitting isochrones from the Padova database to the color–magnitude diagrams confirms our results.
Conclusions. BH 176 is an old metal-rich open or transition-type cluster, moderately close to the Galactic plane. It is a spectacular object for studying the early formation history of our Galaxy.
Key words: globular clusters: individual: BH 176 / Hertzsprung-Russell and C-M diagrams
© ESO, 2011
1. Introduction
The cluster BH 176 (located at RA(2000.0) = 15h39m07.40s, Dec(2000.0) = −50°03′02.7″) is one of a handful of little known clusters in our Galaxy, whose true nature and properties still need to be established. BH 176 was first listed as an open cluster by van den Bergh & Hagen (1975). Webbink (1985) estimated the visual magnitude of the horizontal branch (HB) stars in BH 176 to be ~22.6 mag and derived a distance of 85.7 kpc. Ortolani et al. (1995) carried out V and I photometry of BH 176. The published color-magnitude diagrams (CMD) show that it is a sparsely populated object with only a few stars on the upper red-giant branch (RGB). It is not young, because its CMD has a very red HB, i.e. red clump (RC). The authors estimated a reddening E(B − V) = 0.77 and a distance of 13.4 kpc, and concluded that BH 176 is a borderline case between globular and open cluster.
Phelps & Schick (2003) carried out deeper V and I photometry of the cluster, which enabled them to derive an age of 7 Gyr, a distance of 18.00 kpc, and a metallicity in the range –0.20 < [Fe/H] < 0.20. They estimate the extinction at E(V − I) = 0.70 and a heliocentric distance of 18 kpc. They also conclude that BH 176 is a borderline case. Using the same photometry with different isochrones, Frinchaboy et al. (2006) derived similar cluster parameters and a new distance of 15.8 kpc.
BH 176 is in the direction of the Galactic anticenter stellar stream (GASS), also known as the Monoceros ring (Frinchaboy et al. 2006), where old open clusters and young globular clusters (Marín-Franch et al. 2009) are found. If its distance is at the lower end of the above estimates, BH 176 could well belong to this stream.
Alternatively, if it is farther out, in the Galactic halo, and has lower metallicity, it might belong to the family of “young halo” low-metallicity faint globular clusters found on the outskirts of our Galaxy at large galactocentric distances (R > 15 kpc). These clusters are not numerous (only ~10 are known to date), and they are 3 Gyr younger than the oldest clusters with the same metallicity (van den Bergh 1998; Mackey & van den Bergh 2005). Their origin and the existence of a Galactic structure in which they might be embedded are still under debate. Some of these objects belong to the Sagittarius stream.
In either case, the metallicity of BH 176, its age, and its distance from the Sun are all important parameters to determine, because the true nature of this cluster may improve our understanding of the formation and early evolution of our Galaxy.
2. Extinction in the region of BH 176
The galactic reddening adopted for BH 176 is crucial when deriving its properties from a CMD. Because this cluster lies at a low galactic latitude (b = +4.34 deg), foreground reddening is both large and uncertain. We estimated the total Galactic line-of-sight absorption in the Ks-band using the color excess, E(B − V) = 0.578, derived from IRAS 100 μ emission all-sky maps (Schlegel et al. 1998), and an equation from Bilir et al. (2008) that is specific to 2MASS magnitudes: AKs = 0.382E(B − V). This value, AKs = 0.221, appears to be in good agreement with another accurate estimate provided by Marshall et al. (2006), who use star counts in the infrared combined with the model of Besançon (Robin et al. 2003) to map the extinction at low latitudes. The extinction predicted in this way is AKs = 0.222 ± 0.030 in the closest direction to the cluster, namely l = 328.5 and b = 4.25. We thus used this value and the infrared color excess E(J − Ks) = 0.505E(B − V) (Bilir et al. 2008).
3. The infrared color-magnitude diagram
We extracted positions and J, H, and Ks magnitudes of stars in the region of BH 176 from the Two Micron All Sky Point Source Catalog1, retaining all the stars within 20′ from the center of BH 176.
The infrared CMD for all stars within a radius of 2′ from the center of BH 176 is shown in Fig. 1. We divided the infrared CMD into three regions, approximately corresponding to the three sequences of stars easily recognizable on the CMD, (indicated by I, II, and III in Fig. 1). The line (J − Ks) = 0.3 separates regions I and II. The line Ks0 = −9.09 (J − Ks)0 + 20.0, which has the same slope as the isochrones, separates regions II and III. Its ordinate at the origin is such that the RGB of the assumed member stars falls entirely in region III.
We needed an estimate of the radial extent of the cluster in order to select the cluster and field regions for the CMDs. First we found the difference by eye, comparing the cluster and field CMDs within different radii in an iterative process. We noticed that in the magnitude range 12.35 < Ks0 < 13.5 of region III there are bright stars within 2′ from the center, and almost none in the outer field. There is a concentration of red stars in the published CMDs in the optical bands, and this may indicate the RGB of the cluster. Above V ~ 17.8, I ~ 15.5, there are only a few stars on the RGB (Ortolani et al. 1995). The situation in the optical bands is obviously more complicated than in the infrared because of foreground obscuration. Nevertheless, the distribution of stars in region III (Fig. 1) shows the same behavior as in the optical. The RGB starts to be populated well below the location of the tip of RGB expected from the literature estimates.
To obtain an accurate estimate of size of the cluster, we measured the radial extent of BH176 in the following way. First, we selected all stars of region III in the magnitude range 12.35 < Ks0 < 13.5. The upper limit of this range corresponds roughly to the tip of the RGB, and the lower limit is where contamination by field stars seems to start, when one compares the field and cluster CMDs. Then we defined two rectangular strips, each one 4′ wide and 20′ long, centered on the cluster center, one strip elongated along the right ascensions and the other along the declinations. We counted the number of stars in each strip in bins of 1.8′, with shifts of 3.6″, so there were 30 steps for each bin. The resulting stellar distributions, shown in Fig. 2, are thus sliding means. We refer to Sharina et al. (2006) for a previous application of this method to globular cluster sizes.
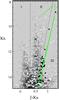 |
Fig. 1 Infrared CMD (corrected for Galactic extinction) for stars within a radius of 2′ from the center of BH176 (white open and black squares), and Hess-diagram for field stars within a ring between radii of 3 and 10′. Contour levels correspond to a number density of stars (1:17) per 0.05 × 0.05 bin of the Hess-diagram. The isochrone from Marigo et al. (2008) for [Fe/H] = −0.2 dex, age of 7 Gyr, and distance modulus of 16.0 is shown in green. The member and nonmember stars from Frinchaboy et al. (2006), some beyond 2′ from the center, are indicated by blue circles and triangles, respectively. Stars with the best photometric quality (A) in the J, H, and Ks bands in region III are shown as filled black squares. |
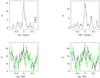 |
Fig. 2 Distribution of the stars in a strip 4′ wide and 20′ long centered on the cluster. Top: stars in region III with 12.35 < Ks < 13.5 along RA and Dec. Bottom: stars with 12.35 < Ks < 13.5 and (J − Ks) < 0.3, stars with Ks < 13.5 and 0.7 > (J − Ks) > 0.3 (RA in black and Dec in green). |
The spatial distribution of the RGB stars has a limiting radius of ~3′, which is larger than the radii of 1.5′ and 2.3′ ± 0.1′ estimated by Dias et al. (2002) and Phelps & Schick (2003), respectively, and much smaller than the tidal radius of 5.9′ ± 0.5′ given by Bonatto et al. (2008). The distributions of blue- (region I) and of intermediate-color (region II) stars of the CMD do not show any concentration toward the center of the cluster. These distributions are shown in Fig. 2.
Region I corresponds to the upper main sequence (MS) of our Galaxy, and region II to its red giant and super-giant sequences. The field stars are located at different distances with internal small-scale variations in reddening and population densities. These two regions are reproduced well by models of stellar population synthesis of the Galaxy2 (Robin et al. 2003). Region III corresponds to stars within ~2′ of the cluster center. After counting stars in region III of the CMD and normalizing to the total number of stars in all three regions within the same radius, we find that there are 4.8 times as many stars in the cluster than in the field (23/333 compared to 79/5530).
Several field and cluster member stars were identified in the region of this cluster by Frinchaboy et al. (2006) on the basis of radial-velocity measurements. The six cluster member stars detected in the infrared are indicated in Fig. 1. Some of the nonmembers are not shown in Fig. 1 because they are beyond 2′ from the center.
The slope and color of the RGB in the CMDs of a globular cluster have often been considered as indicators of their metallicity (Zinn & West 1984; Zinn 1985) in the infrared (Kuchinski et al. 1995; Kuchinski & Frogel 1995) and in the optical (Sarajedini 1994; Sarajedini & Layden 1997). We used the improved calibration of Carney et al. (2005) to estimate the metallicity3 of BH176 from the 2MASS photometric data. Since we do not see the HB, we cannot estimate the mean magnitude of the RGB. However, we may estimate its slope, which is equal to  if one uses an ordinary least-squares bisector fitting routine. Equation (5) of Carney et al. (2005) predicts
 ![\hbox{$\rm [Fe/H]_{ZW}=-0.22^{+0.40}_{-0.32}$}](/articles/aa/full_html/2011/04/aa15514-10/aa15514-10-eq46.png) dex. This model was carefully chosen to determine the age of BH176 and to find out whether it contains stars in the thermally-pulsing asymptotic giant branch phase. The deep CMD in the V and I bands, reaching the main sequence turn-off (MSTO), will be helpful to answer this question. It is also necessary to better constrain the distance and evolutionary parameters of the cluster, since the location of the tip of the RGB in the K-band is a strong function of metallicity (Marigo et al. 2008).
dex. This model was carefully chosen to determine the age of BH176 and to find out whether it contains stars in the thermally-pulsing asymptotic giant branch phase. The deep CMD in the V and I bands, reaching the main sequence turn-off (MSTO), will be helpful to answer this question. It is also necessary to better constrain the distance and evolutionary parameters of the cluster, since the location of the tip of the RGB in the K-band is a strong function of metallicity (Marigo et al. 2008).
4. FORS2 VLT images
4.1. Observational data and their reduction
We used archival FORS2 VLT images of the program 077.D-0775(B) in the V and I bands, two with exposures 0.3 s and two with exposures 30 s, to carry out PSF-fitting photometry using the DAOPHOT II/ALLSTAR procedure (Stetson et al. 1990) at a detection threshold ≥ 3. With the DAOPHOTII find procedure, we selected unsaturated stars with the sharpness parameter in the range 0.2 < sharp < 1. After the photometric process we rejected objects with χ > 2. A comparison between the magnitudes of the same stars in the 30 s and 0.3 s. exposures is shown in Fig. 3.
To transform our results into the standard Johnson-Cousins system, we used the FORS2 photometric zeropoints4I0 = 27.664 and V0 = 28.092 for chip 1, and I0 = 27.688 and V0 = 28.127 for chip 2, and extinction coefficients kI = 0.025 and kV = 0.122. The results of our artificial star experiments are shown in Fig. 4. The authors of program 077.D-0775(B) made a very fortunate choice of exposure times, because stars above I ~ 15.5 are saturated on exposure times greater than 0.3 s. The short exposure thus allowed us to obtain magnitudes of all the bright stars of BH176 down to the level of the HB with an S/N ~ 5. Strong crowding would not have allowed us to obtain accurate photometry and reach below the MSTO with exposures longer than 30 s and a seeing on the order of 1″.
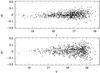 |
Fig. 3 Comparison between magnitudes of the same stars in the 30 s and 0.3 s FORS2 exposures. |
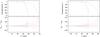 |
Fig. 4 V and I completeness and photometric errors for the 30 s (red) and 0.31 s (black) images. In the bottom panels the lines show the mean output minus input magnitudes of artificial stars, and the error bars show the 1σ distribution. |
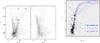 |
Fig. 5 Left: CMD within 1.5′ of the center of BH 176, obtained by photometry of FORS2 VLT images. The mean MS and RGB ridge line is overplotted. Middle: CMD in outer region 1 (RA(2000.0) = 234.72713 deg, Dec(2000.0) = − 50.000356 deg) of BH 176, also within a radius of 1.5′. Right: Hess-diagram of BH176, with three isochrones from Marigo et al. (2008), with an age of 7 Gyr and metallicities of 0.0, –0.1 and –0.2. |
4.2. CMD: selection of the cluster population
The resulting cluster (Radius ≤ 1.5′) and field CMDs, uncorrected for Galactic extinction are shown in Fig. 5. Regions I, II, and III in this figure are analogous to those marked in Fig. 1 (see previous section). They schematically separate Galactic and cluster stars. Below the line I = −6.9(V − I) + 29 and V − I < 1.8 the CMD is significantly contaminated by Galactic MS, red supergiant and RGB stars. The range of colors (V − I) in the left and middle panels was reduced to reveal the details of the CMD better at faint magnitudes. The actual color range spanned by the cluster stars is [0.4, 5.2] mag. There are three bright stars with (V − I) ≥ 3 located near the center of the cluster, revealing an “RGB curvature” first seen by Ortolani et al. (1995). The RGB, RC, subgiant branch (SGB), and MSTO are seen in the cluster CMD and absent in the field one. All these features, except the upper RGB, were also seen in the CMD published by Phelps & Schick (2003). However, their images did not allow them to obtain the photometry of the bright stars in the cluster.
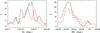 |
Fig. 6 Distribution of RGB stars of the cluster (region III of Fig. 5, left panel) brighter than the level of HB (shown in red), and of RC stars (shown in black) in strips of 3′ centering the cluster along right ascension and declination. |
Because BH176 covers an area 6′ × 6′ (see previous section), the 7′ × 6′ field of the FORS2 images is not sufficient to subtract the field stars from the cluster ones accurately. Figure 6 shows the distribution of the RC and RGB stars of the cluster along right ascension and declination. Significant small-scale variations in population densities on the CMD make the statistical subtraction imperfect. We restricted the cluster size to a small area (3′ × 3′) to avoid strong field contamination and to increase the S/N. Finally, we were able to find two regions (1 and 2) in the frame with diameters of 3 ′ relatively clear of cluster stars. Their respective centers, RA(2000.0) = 234.72713 deg, Dec(2000.0) = −50.00036 deg, and RA(2000.0) = 234.83165 deg, Dec(2000.0) = −50.0 deg are located in the two northern (upper) corners of the FORS2 field of view. The statistically cleaned CMD of the cluster is shown in Fig. 5, right panel. It was obtained by subtracting the hess-diagram counted for the CMD of the outer field 3′ × 3′ region (Fig. 5, middle panel) from the CMD of the central cluster region (Fig. 5, left panel).
We have outlined the ridge line of the upper MS, SGB and RGB on the CMD of the cluster. It is overplotted in the left panel of Fig. 5. The (V − I, I) plane was used instead of (V − I, V), because the SGB is monotonically increasing in the (V − I, I) plane, and linear interpolation gives more accurate results. Then we subtracted the color of the ridge line from the color of each star by linear interpolation so as to have a SGB and RGB that stand vertically. The result is plotted in Fig. 7 (left panel) for stars in the 3′ × 3′ area around the center of the cluster (black dots), and in the 3′ × 3′ outer region (green dots). Star counts within small bins (δI ≤ 0.1 mag) along the V-axis allowed us to calculate a statistically cleaned V-band luminosity function of the cluster for stars located close to the ridge line. The maximum distance δ(V − I) ~ 0.11 mag (indicated by a red line in Fig. 7, left panel) was chosen empirically to include the RC stars without adding too much noise. The procedure for constructing the luminosity function is demonstrated in Fig. 7, right panel. Following the steps mentioned above we derived the V and I positions of the RC, probable RGB bump (RB) and MSTO, which are summarized in Table 1 which give in the successive rows: the color excess and extinction coefficients; the magnitudes and colors corrected for Galactic extinction of the RC, MSTO, and RGB bump; the difference in the V magnitudes between RC and RGB bump, and between MSTO and RC; the distance modulus, obtained using  (Girardi & Salaris 2001); different metallicities estimates.
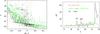 |
Fig. 7 Left: verticalized CMD of the cluster (black dots) and outer (green dots) regions plotted in the (V, V − I) plane (see text for details). Right: V-band luminosity functions computed within 0.1 mag wide bins for stars close to the ridge line (δ(V − I) ≤ 0.11 mag) located in the cluster (red line) and outer (green line) regions; and the difference between these two histograms (black line). |
Main parameters for BH176 obtained from the optical CMD and theoretical considerations from the literature.
4.3. Metallicity and age of BH176
Girardi & Salaris (2001) theoretically predict the absolute magnitude of the RC in the I-band as a function of age and metallicity. We used their Table 1 and Fig. 1 to estimate first the metallicity of BH176. According to Girardi & Salaris (2001), the (V − I)0 color of RC depends mainly on metallicity for ages older than ~3 Gyr. As a first approximation we used an age of 7 Gyr. We obtained a metallicity [Fe/H] = −0.17 ± 0.1 dex. Then using this value we estimated MiRC ~ −0.17 for the age of 7 Gyr by linear interpolation in Table 1 of Girardi & Salaris (2001). The latter value gives us the distance modulus of BH176: (m − M)0 = 15.9 ± 0.07 mag. If we use for instance an age of 6 Gyr, this leads to MiRC ~ −0.2, and a distance modulus of 15.93 mag.
Another method to determine metallicity is provided by Sarajedini (1994), and Sarajedini & Milone (1995). In that method, [Fe/H] is a function of the mean color of the red HB,  , and of the difference in V-magnitude between the HB and RGB at (V − I)0 = 1.1, 1.15, 1.2:
![$${\rm [Fe/H]} = 9.688 \cdot (V-I)_0^{\rm RC} -10.64,$$](/articles/aa/full_html/2011/04/aa15514-10/aa15514-10-eq111.png)
![$${\rm [Fe/H]} = -0.9609 \Delta V_{1.1} - 0.2400,$$](/articles/aa/full_html/2011/04/aa15514-10/aa15514-10-eq112.png)
![$${\rm [Fe/H]} = -0.9439 \Delta V_{1.15} + 0.0270,$$](/articles/aa/full_html/2011/04/aa15514-10/aa15514-10-eq113.png)
![$${\rm [Fe/H]} = -0.9367 \Delta V_{1.2} +0.2606 .$$](/articles/aa/full_html/2011/04/aa15514-10/aa15514-10-eq114.png) The rms in these relations is about 0.05 according to Sarajedini. We know that our fiducial sequence for BH176 is not ideal, so the idea is to calculate metallicity as an average of these four methods. The first equation leads to [Fe/H] = −0.54. From our CMD we measure: ΔV1.1 ~ −0.29 mag, ΔV1.15 ~ 0.046, ΔV1.2 ~ 0.296. The corresponding [Fe/H] values are 0.02, –0.017, and − 0.02 dex. A mean of the four values is [Fe/H] = −0.14 dex, in good agreement with our previous estimates.
The rms in these relations is about 0.05 according to Sarajedini. We know that our fiducial sequence for BH176 is not ideal, so the idea is to calculate metallicity as an average of these four methods. The first equation leads to [Fe/H] = −0.54. From our CMD we measure: ΔV1.1 ~ −0.29 mag, ΔV1.15 ~ 0.046, ΔV1.2 ~ 0.296. The corresponding [Fe/H] values are 0.02, –0.017, and − 0.02 dex. A mean of the four values is [Fe/H] = −0.14 dex, in good agreement with our previous estimates.
We evaluated the age of BH176 using the vertical method (Buonanno et al. 1998; Salaris & Weiss 1998; Rosenberg et al. 1999; VandenBerg 2000; De Angeli et al. 2005). This method rests on the V-band difference ΔV(TO-HB) between HB and MSTO. Since the HB of BH176 is very red, we used the mean V-magnitude of stars in the RC for this method. The difference is ~2.9 ± 0.2 mag. The estimate is not perfect owing to the poor accuracy of our MSTO determination. This point is near the 50% detection limit according to our artificial star experiments. Using this difference and theoretical considerations (Table 2, see also De Angeli et al. 2005), we may conclude that BH 176 is younger than 8 Gyr. ΔV(TO-HB) does not depend strongly on metallicity for [Fe/H] ≥ − 0.5 dex (e.g. Fig. 5 in De Angeli et al. 2005; Table 2 in this paper). We find an age in the range 6–7 Gyr, so 7 Gyr is a safe estimate of the age.
In order to check whether our distance, extinction, metallicity, and age estimates fit our ridge line, we overplotted isochrones of Marigo et al. (2008) on our statistically cleaned CMD (Figs. 5, right panel, and 8). In Fig. 5 (right panel) the track: z = 0.016 and age = 7 Gyr fits our data particularly well. In Fig. 8 we used the V, (V − I) plane, and two isochrones of 5 Gyr with [Fe/H] = −0.2 and 0.0 dex; and the isochrone of 8 Gyr and [Fe/H] = 0.0. The metallicity and age for BH176 are well inside the range [Fe/H] : − 0.2 ÷ 0 dex, and age of 5 ÷ 8 Gyr. The reddest bright star is probably a carbon-rich asymptotic giant branch star.
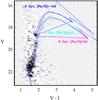 |
Fig. 8 Statistically cleaned CMD of BH176. Isochrones from Marigo et al. (2008) with ages of 5, 5 and 8 Gyr and corresponding metallicities of –0.2, 0.0 and 0.0, respectively, are overplotted. |
5. BH 176 in context
We used archival visual and infrared observational data to improve our knowledge of the poorly known Galactic star cluster BH 176. Additionally, we explored the Galactic extinction in its direction. Adopting a distance modulus of (m − M)0 = 15.9 ± 0.07, we obtain the following spatial characteristics for BH 176: distance from the Sun R⊙ = 15.1 ± 0.5 kpc Galactic coordinates (in kpc) X = 12.8, Y = −7.9, Z = 1.1. The apparent magnitude mV = 14 (Harris 1996) corresponds to an absolute magnitude Mv = −3.82, using an extinction Av = 1.79. We found a high metallicity [Fe/H] = −0.1 ± 0.1 dex and an age in the range 6–7 Gyr.
These properties, together with its radial velocity (Frinchaboy et al. 2006), do not make its origin very obvious. At such a distance from the Sun, BH 176 may belong to the Monoceros ring, which has been modeled to lie at a heliocentric distance of about 25 kpc at the longitude of BH 176 (Peñarrubia et al. 2005). However, its age and metallicity do not fit the age-metallicity relation of this structure (Frinchaboy et al. 2006).
The other important issue concerning this cluster is its true nature, open or globular. In fact, there are no globular clusters with similar properties in the catalog of Harris (1996). Most faint globular clusters are metal-poor objects in the outer halo (van den Bergh 1998; Mackey & van den Bergh 2005). Very few are faint, metal-rich and young. Pal 1, the faintest (Mv = −2.54) and youngest (6.8–8 Gyr) known, is considered a globular cluster, but a different formation history must be advocated for it (Rosenberg et al. 1999). On the other hand, the properties of BH176 are not unique among old Galactic open clusters (Dias et al. 2002). There are eight open cluster in their updated list5 with an age in the range 5–8 Gyr and a metallicity estimate; the mean metallicity of this sample is [Fe/H] = –0.25, its mean distance 6.5 kpc, and its mean diameter 8.3 pc. In other words, BH 176 is more distant and larger than this small sample, so it could possibly be labeled a transition-type cluster.
High-resolution spectroscopy of its stars will obviously be helpful for determining its properties more accurately.
Acknowledgments
We thank the referee (F. Fusi Pecci) for valuable comments and for pointing out to us availability of relevant data in the ESO archives. We thank Annie Robin for directing us to the paper by Marshall et al., and Pascal Fouqué for useful comments. M. Sharina thanks the Observatoire Midi-Pyrénées for a four-month senior scientist’s position during which this research was performed. This research is based on observations made with ESO Telescopes at the Paranal Observatories under program ID 077.D-0775(B), and it made use of the NASA/IPAC Infrared Science Archive, which is operated by the Jet Propulsion Laboratory, California Institute of Technology, under contract with the National Aeronautics and Space Administration.
References
- Alves, D. R., & Sarajedini, A. 1999, ApJ, 511, 225 [NASA ADS] [CrossRef] [Google Scholar]
- Bertelli, G., Bressan, A., Chiosi, C., Fagotto, F., & Nasi, E. 1994, A&AS, 106, 275 [NASA ADS] [Google Scholar]
- Bilir, S., Ak, S., Karaali, S., et al. 2008, MNRAS, 384, 1178 [NASA ADS] [CrossRef] [Google Scholar]
- Bonatto, C., & Bica, E. 2008, A&A, 479, 741 [NASA ADS] [CrossRef] [EDP Sciences] [Google Scholar]
- Buonanno, R., Corsi, C. E., Pulone, L., Fusi Pecci, F., & Bellazzini, M. 1998, A&A, 333, 505 [NASA ADS] [Google Scholar]
- Carney, B. W., Lee, J.-W., & Dodson, B. 2005, AJ, 129, 656 [NASA ADS] [CrossRef] [Google Scholar]
- De Angeli, F., Piotto, G., Cassisi, S., et al. 2005, AJ, 130, 116 [NASA ADS] [CrossRef] [Google Scholar]
- Dias, W. S., Alessi, B. S., Moitinho, A., & Lépine, J. R. D. 2002, A&A, 389, 871 [NASA ADS] [CrossRef] [EDP Sciences] [Google Scholar]
- Frinchaboy, P. M., Muñoz, R. R., Phelps, R. L., et al. 2006, AJ, 131, 922 [NASA ADS] [CrossRef] [Google Scholar]
- Fusi Pecci, F., Ferraro, F., Crocker, D., & Buonanno, R. 1990, A&A, 238, 95 [NASA ADS] [Google Scholar]
- Girardi, L., & Salaris, M. 2001, MNRAS, 323, 109 [NASA ADS] [CrossRef] [Google Scholar]
- Harris, W. E. 1996, AJ, 112, 1487 [NASA ADS] [CrossRef] [Google Scholar]
- Kuchinski, L. E., & Frogel, J. A. 1995, AJ, 110, 2844 [NASA ADS] [CrossRef] [Google Scholar]
- Kuchinski, L. E., Frogel, J. A., Terndrup, D. M., & Persson, S. E. 1995, AJ, 109, 1131 [NASA ADS] [CrossRef] [Google Scholar]
- Lee, M. G., Freedman, W. L., & Madore, B. F. 1993, ApJ, 417, 553 [Google Scholar]
- Mackey, A. D., & van den Bergh, S. 2005, MNRAS, 360, 631 [NASA ADS] [CrossRef] [Google Scholar]
- Marigo, P., Girardi, L., Bressan, A., et al. 2008, A&A, 482, 883 [NASA ADS] [CrossRef] [EDP Sciences] [Google Scholar]
- Marín-Franch, A., Aparicio, A., Piotto, G., et al. 2009, ApJ, 694, 1498 [NASA ADS] [CrossRef] [Google Scholar]
- Marshall, D. J., Robin, A. C., Reylé, C., Schultheis, M., & Picaud, S. 2006, A&A, 453, 635 [NASA ADS] [CrossRef] [EDP Sciences] [Google Scholar]
- Ortolani, S., Bica, E., & Barbuy, B. 1995, A&A, 300, 726 [NASA ADS] [Google Scholar]
- Peñarrubia, J., Martínez-Delgado, D., Rix, H. W., et al. 2005, ApJ, 626, 128 [NASA ADS] [CrossRef] [Google Scholar]
- Phelps, R. L., & Schick, M. 2003, AJ, 126, 265 [NASA ADS] [CrossRef] [Google Scholar]
- Robin, A. C., Reylé, C., Derrière, S., & Picaud, S. 2003, A&A, 409, 523 [NASA ADS] [CrossRef] [EDP Sciences] [Google Scholar]
- Rosenberg, A., Saviane, I., Piotto, G., Aparicio, A., & Zaggia, S. R. 1998, AJ, 115, 648 [NASA ADS] [CrossRef] [Google Scholar]
- Rosenberg, A., Saviane, I., Piotto, G., & Aparicio, A. 1999, AJ, 118, 2306 [NASA ADS] [CrossRef] [Google Scholar]
- Salaris, M., & Weiss, A. 1998, A&A, 335, 943 [NASA ADS] [Google Scholar]
- Sarajedini, A. 1994, AJ, 107, 618 [NASA ADS] [CrossRef] [Google Scholar]
- Sarajedini, A., & Milone, A. A. E. 1995, AJ, 109, 269 [NASA ADS] [CrossRef] [Google Scholar]
- Sarajedini, A., & Layden, A. 1997, AJ, 113, 264 [NASA ADS] [CrossRef] [Google Scholar]
- Schlegel, D. J., Finkbeiner, D. P., & Davis, M. 1998, ApJ, 500, 525 [NASA ADS] [CrossRef] [Google Scholar]
- Sharina, M. E., Afanasiev, V. L., & Puzia, T. H. 2006, MNRAS, 372, 1259 [NASA ADS] [CrossRef] [Google Scholar]
- Stetson P. B., Davis L. E., & Crabtree D. R. 1990, in CCDs in Astronomy (San Francisco: ASP), ASP Conf. Ser., 8, 289 [Google Scholar]
- VandenBerg, D. A. 2000, ApJS, 129, 315 [NASA ADS] [CrossRef] [Google Scholar]
- van den Bergh, S. 1998, ApJ, 495, L79 [NASA ADS] [CrossRef] [Google Scholar]
- van den Bergh, S., & Hagen, G. L. 1975, AJ, 80, 11 [NASA ADS] [CrossRef] [Google Scholar]
- Webbink, R. F. 1985, in Dynamics of star clusters, IAU Symp., 113, 541 [Google Scholar]
- Zinn, R. 1985, ApJ, 293, 424 [Google Scholar]
- Zinn, R., & West, M. J. 1984, ApJS, 55, 45 [NASA ADS] [CrossRef] [Google Scholar]
All Tables
Main parameters for BH176 obtained from the optical CMD and theoretical considerations from the literature.
All Figures
|
Fig. 1 Infrared CMD (corrected for Galactic extinction) for stars within a radius of 2′ from the center of BH176 (white open and black squares), and Hess-diagram for field stars within a ring between radii of 3 and 10′. Contour levels correspond to a number density of stars (1:17) per 0.05 × 0.05 bin of the Hess-diagram. The isochrone from Marigo et al. (2008) for [Fe/H] = −0.2 dex, age of 7 Gyr, and distance modulus of 16.0 is shown in green. The member and nonmember stars from Frinchaboy et al. (2006), some beyond 2′ from the center, are indicated by blue circles and triangles, respectively. Stars with the best photometric quality (A) in the J, H, and Ks bands in region III are shown as filled black squares. |
| In the text | |
|
Fig. 2 Distribution of the stars in a strip 4′ wide and 20′ long centered on the cluster. Top: stars in region III with 12.35 < Ks < 13.5 along RA and Dec. Bottom: stars with 12.35 < Ks < 13.5 and (J − Ks) < 0.3, stars with Ks < 13.5 and 0.7 > (J − Ks) > 0.3 (RA in black and Dec in green). |
| In the text | |
|
Fig. 3 Comparison between magnitudes of the same stars in the 30 s and 0.3 s FORS2 exposures. |
| In the text | |
|
Fig. 4 V and I completeness and photometric errors for the 30 s (red) and 0.31 s (black) images. In the bottom panels the lines show the mean output minus input magnitudes of artificial stars, and the error bars show the 1σ distribution. |
| In the text | |
|
Fig. 5 Left: CMD within 1.5′ of the center of BH 176, obtained by photometry of FORS2 VLT images. The mean MS and RGB ridge line is overplotted. Middle: CMD in outer region 1 (RA(2000.0) = 234.72713 deg, Dec(2000.0) = − 50.000356 deg) of BH 176, also within a radius of 1.5′. Right: Hess-diagram of BH176, with three isochrones from Marigo et al. (2008), with an age of 7 Gyr and metallicities of 0.0, –0.1 and –0.2. |
| In the text | |
|
Fig. 6 Distribution of RGB stars of the cluster (region III of Fig. 5, left panel) brighter than the level of HB (shown in red), and of RC stars (shown in black) in strips of 3′ centering the cluster along right ascension and declination. |
| In the text | |
|
Fig. 7 Left: verticalized CMD of the cluster (black dots) and outer (green dots) regions plotted in the (V, V − I) plane (see text for details). Right: V-band luminosity functions computed within 0.1 mag wide bins for stars close to the ridge line (δ(V − I) ≤ 0.11 mag) located in the cluster (red line) and outer (green line) regions; and the difference between these two histograms (black line). |
| In the text | |
|
Fig. 8 Statistically cleaned CMD of BH176. Isochrones from Marigo et al. (2008) with ages of 5, 5 and 8 Gyr and corresponding metallicities of –0.2, 0.0 and 0.0, respectively, are overplotted. |
| In the text | |
Current usage metrics show cumulative count of Article Views (full-text article views including HTML views, PDF and ePub downloads, according to the available data) and Abstracts Views on Vision4Press platform.
Data correspond to usage on the plateform after 2015. The current usage metrics is available 48-96 hours after online publication and is updated daily on week days.
Initial download of the metrics may take a while.