Fig. 6
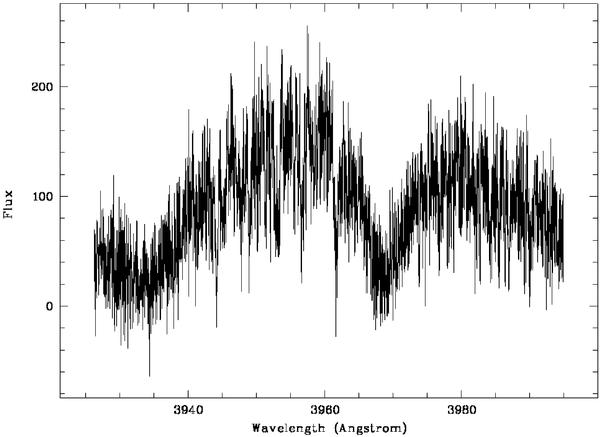
Calcium II H and K lines. This plot shows the calcium II H and K lines obtained from the HIRES spectra, with Ca II K on the left (centered at about 3929 Å) and Ca II H on the right (centered at about 3978 Å. No evidence of emission in the cores of these lines can be seen, which is consistent with a star of low magnetic activity.
Current usage metrics show cumulative count of Article Views (full-text article views including HTML views, PDF and ePub downloads, according to the available data) and Abstracts Views on Vision4Press platform.
Data correspond to usage on the plateform after 2015. The current usage metrics is available 48-96 hours after online publication and is updated daily on week days.
Initial download of the metrics may take a while.