Fig. 2
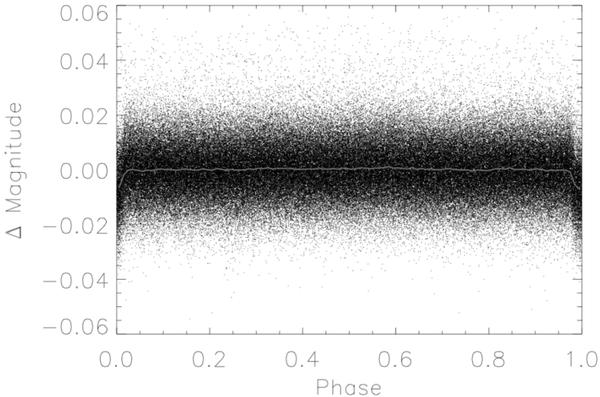
The full phase-folded light curve of CoRoT-14. The light curve shown has been corrected for jitter, hot pixels, and other effects, then folded with the known period for CoRoT-14b, with the center of transit at 0. These observations were also binned into 100 evenly-spaced bins, represented by a gray line. No out-of-transit variations are apparent.
Current usage metrics show cumulative count of Article Views (full-text article views including HTML views, PDF and ePub downloads, according to the available data) and Abstracts Views on Vision4Press platform.
Data correspond to usage on the plateform after 2015. The current usage metrics is available 48-96 hours after online publication and is updated daily on week days.
Initial download of the metrics may take a while.