Fig. 7
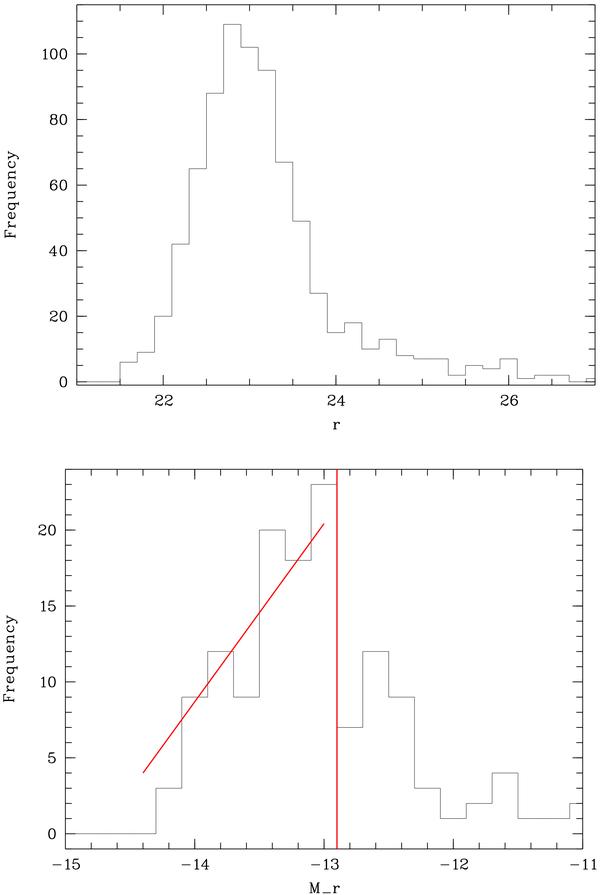
Upper figure: r′-band magnitude histogram of the 783 fLSBs with available photo-zs. Lower figure: luminosity function for the 142 fLSBs with photo-z < 0.2 as a function of absolute r′-band magnitude (assuming these objects are cluster members). The vertical line shows the approximate completeness level of the fLSB sample derived from our simulations. The oblique line shows the mean slope of the luminosity function for absolute r′-band magnitude brighter than − 12.9 (see text).
Current usage metrics show cumulative count of Article Views (full-text article views including HTML views, PDF and ePub downloads, according to the available data) and Abstracts Views on Vision4Press platform.
Data correspond to usage on the plateform after 2015. The current usage metrics is available 48-96 hours after online publication and is updated daily on week days.
Initial download of the metrics may take a while.