Fig. 6
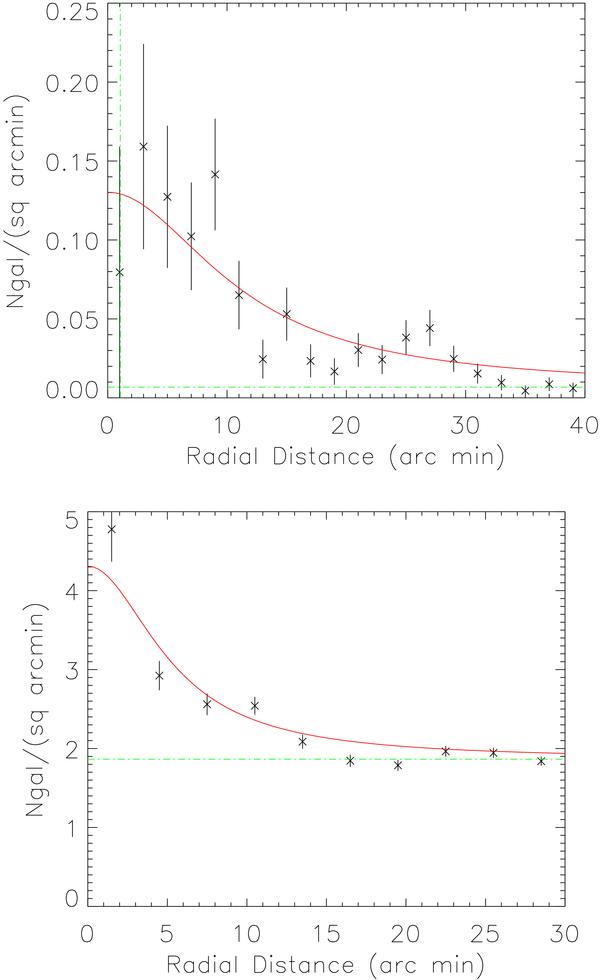
Upper figure: number of galaxies per square arcmin versus distance to the cluster center, considering the 142 fLSBs with photo-z < 0.2. The vertical dashed line shows the cluster central galaxy radius. Lower figure: number of galaxies per square arcmin versus distance to the cluster center, considering the 5766 galaxies with photo-z < 0.2 (fLSBs and normal galaxies). The red lines show the best King model fits in both cases. The green horizontal lines show the respective background contributions.
Current usage metrics show cumulative count of Article Views (full-text article views including HTML views, PDF and ePub downloads, according to the available data) and Abstracts Views on Vision4Press platform.
Data correspond to usage on the plateform after 2015. The current usage metrics is available 48-96 hours after online publication and is updated daily on week days.
Initial download of the metrics may take a while.