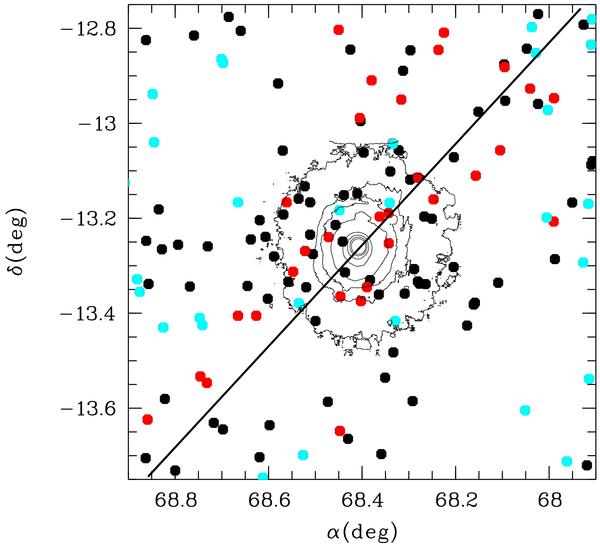
Fig. 4

Positions of the fLSBs with photo-z < 0.2. Black, cyan and red points correspond to fLSBs within ± 1σ of the red sequence, below, and above this interval respectively. The black line indicates the direction of the very large scale filament of galaxies found by Boué et al. (2008) – see their Fig. 10. The contours correspond to the X-ray emission from the XMM-Newton EPIC MOS1 image (Laganá et al. 2008).
Current usage metrics show cumulative count of Article Views (full-text article views including HTML views, PDF and ePub downloads, according to the available data) and Abstracts Views on Vision4Press platform.
Data correspond to usage on the plateform after 2015. The current usage metrics is available 48-96 hours after online publication and is updated daily on week days.
Initial download of the metrics may take a while.


