Fig. 9
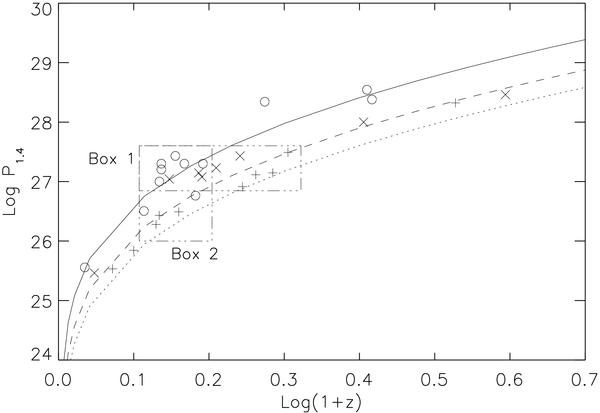
Distribution of Log(radio power) vs. Log(1 + z) for the galaxies of the composite sample. Empty circles represent 3CR&PW sources; crosses and plus signs are the two B3-VLA sub-samples. The lines correspond to flux densities S1.4 = 2.1 Jy, 0.66 Jy and 0.33 Jy, representing the flux density limits of the three samples extrapolated at 1.4 GHz.
Current usage metrics show cumulative count of Article Views (full-text article views including HTML views, PDF and ePub downloads, according to the available data) and Abstracts Views on Vision4Press platform.
Data correspond to usage on the plateform after 2015. The current usage metrics is available 48-96 hours after online publication and is updated daily on week days.
Initial download of the metrics may take a while.