Fig. 14
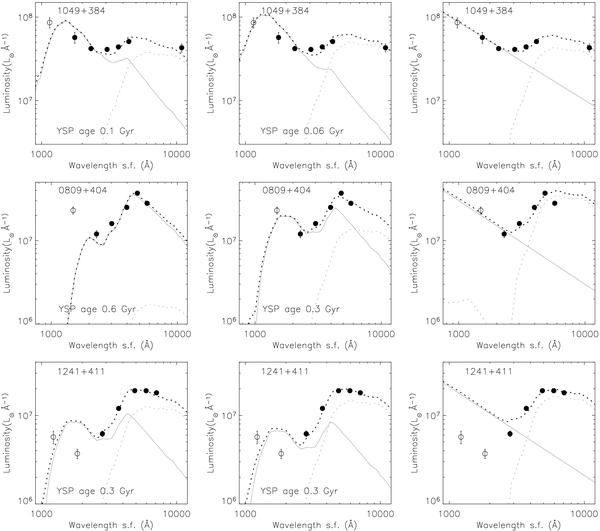
Examples of model-fitting. The thin lines represent an OSP model (at the longer wavelengths) and either a power law (right-hand panels) or two different YSP models (left hand and middle panels) which give similar fits to the data. The line through the data points is the sum of the two sub-components. GALEX data, not used in the fits, are overplotted as empty circles. Top row: the GALEX point does not discriminate among the three models based on SDSS data. Center row: the GALEX point is in better agreement with the second, SDSS based, YSP model, which can be slightly improved by minor changes. Bottom row: the left hand and right hand panels show the best fits with the SDSS data only. The center panel shows a slight modification of the 0.3 Gyr YSP model which, although unsatisfactory at the shortest wavelengths, represents the best model when the GALEX data are added.
Current usage metrics show cumulative count of Article Views (full-text article views including HTML views, PDF and ePub downloads, according to the available data) and Abstracts Views on Vision4Press platform.
Data correspond to usage on the plateform after 2015. The current usage metrics is available 48-96 hours after online publication and is updated daily on week days.
Initial download of the metrics may take a while.