Fig. 13
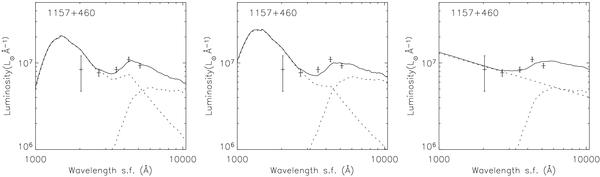
Example of different models yielding similar fits: left hand and center panels fits with two YSP models of ages 0.1 and 0.06 Gyr respectively; right hand panel fit with the power law model. The dotted lines represent an OSP model (at the longer wavelengths) and either a power law (right-hand panels) or two different YSP models (left hand and middle panels). The line through the data points is the sum of the two sub-components.
Current usage metrics show cumulative count of Article Views (full-text article views including HTML views, PDF and ePub downloads, according to the available data) and Abstracts Views on Vision4Press platform.
Data correspond to usage on the plateform after 2015. The current usage metrics is available 48-96 hours after online publication and is updated daily on week days.
Initial download of the metrics may take a while.