Free Access
Fig. 11
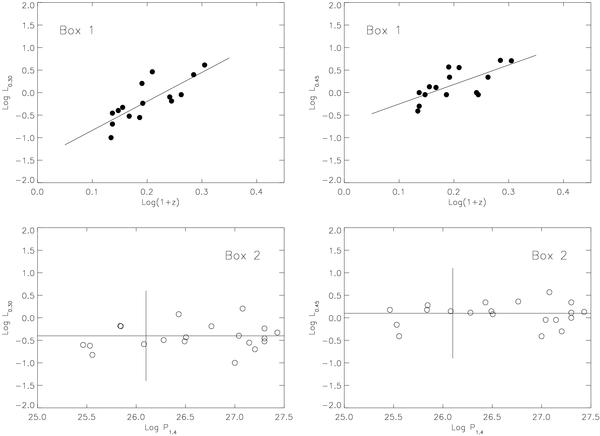
Top panels: enlargement of left hand panels of Fig. 10 for the sources in Box 1. Bottom panels: enlargement of right hand panels of Fig. 10 for the sources in Box 2 (to the right of the vertical line), and for the sources with z ≤ 0.3 (to the left of the vertical line). The lines through the plotted data are the best-fits.
Current usage metrics show cumulative count of Article Views (full-text article views including HTML views, PDF and ePub downloads, according to the available data) and Abstracts Views on Vision4Press platform.
Data correspond to usage on the plateform after 2015. The current usage metrics is available 48-96 hours after online publication and is updated daily on week days.
Initial download of the metrics may take a while.