Fig. 10
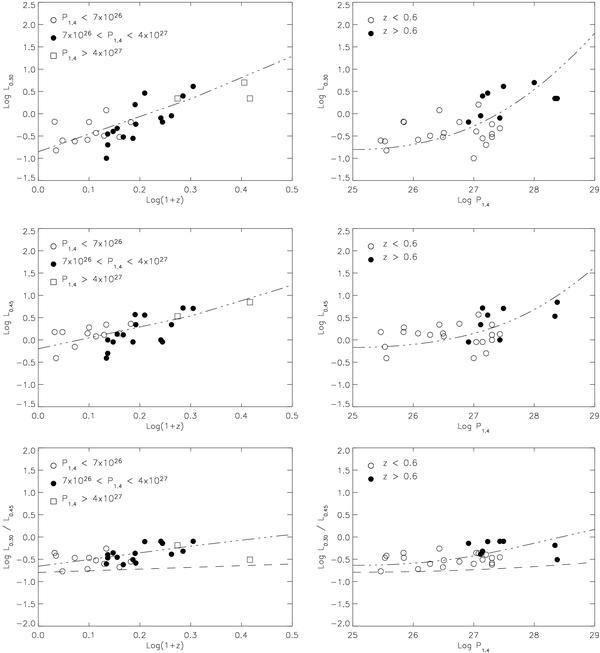
Correlations between Log(L0.30), Log(L0.45) and Log( ) with Log(1 + z) (left) and Log(P1.4) (right) for CSOs/MSOs. The curved lines in the left-hand plots represent the fits to the data obtained using Eq. (2) (page ). The curves in the right-hand plots show how the relations with (1 + z) reflect on P1.4 because of the P1.4–(1 + z) dependence (Fig. 9), for a flux density limit S1.4 = 1.5 Jy. The almost horizontal dashed lines in the two bottom panels represent the expected value of Log() for an old elliptical galaxy.
Current usage metrics show cumulative count of Article Views (full-text article views including HTML views, PDF and ePub downloads, according to the available data) and Abstracts Views on Vision4Press platform.
Data correspond to usage on the plateform after 2015. The current usage metrics is available 48-96 hours after online publication and is updated daily on week days.
Initial download of the metrics may take a while.