Fig. 8
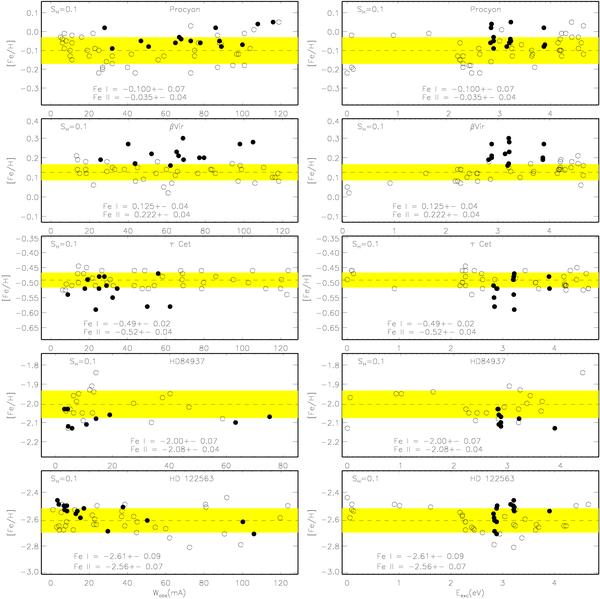
Non-LTE (SH = 0.1) differential abundances derived from the Fe i (open circles) and Fe ii (filled circles) lines in the selected stars as a function of the observed equivalent width (left column panels) and excitation energy of the lower level (right column panels). In each panel, the dashed line shows the mean iron abundance determined from the Fe i lines. See text for more details.
Current usage metrics show cumulative count of Article Views (full-text article views including HTML views, PDF and ePub downloads, according to the available data) and Abstracts Views on Vision4Press platform.
Data correspond to usage on the plateform after 2015. The current usage metrics is available 48-96 hours after online publication and is updated daily on week days.
Initial download of the metrics may take a while.