Fig. 1
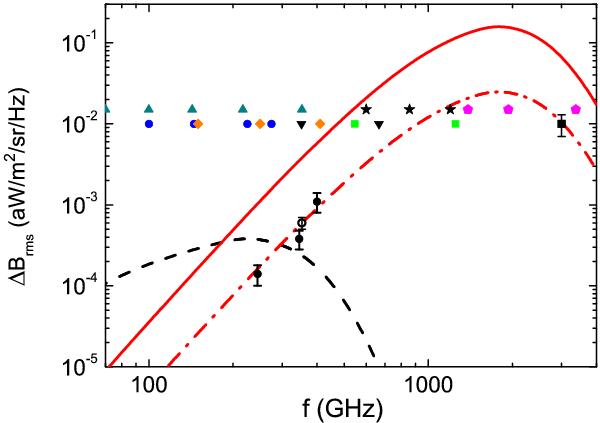
Measurements of rms fluctuations in interstellar dust emission at Galactic latitudes above 20° (data points with error bars) from BOOMERanG (filled circles, Masi et al. 2001, 2006) and Archeops (empty circle, Ponthieu et al. 2005). The continuous line is a thermal spectrum with Td = 18 K and ν2 emissivity. The dashed line represents rms CMB anisotropy for ΔT/T = 10-5. The dash-dotted line represents the spectrum of the polarized signal from a dust cloud with brightness of 1 mKRJ at 353 GHz and 10% polarization (see Benoit et al. 2004). The symbols mark the frequency bands explored by forthcoming polarization measurements from several experiments: Planck (up triangles), PILOT (squares), BLAST-Pol (stars), SPIDER (circles), EBEX (diamonds), SCUBA2 (down triangles), SOFIA (upgraded HAWC: pentagons).
Current usage metrics show cumulative count of Article Views (full-text article views including HTML views, PDF and ePub downloads, according to the available data) and Abstracts Views on Vision4Press platform.
Data correspond to usage on the plateform after 2015. The current usage metrics is available 48-96 hours after online publication and is updated daily on week days.
Initial download of the metrics may take a while.