Fig. 6
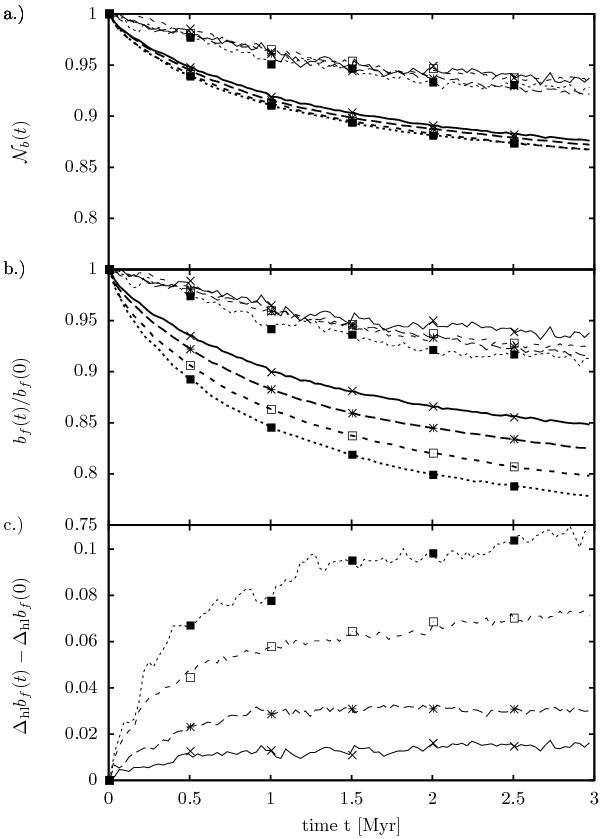
Panel a) evolution of the normalized number of binary systems with primary masses exceeding 2 M⊙ (thin lines) and binaries with masses below 2 M⊙ (thick lines) with time. Panel b) evolution of the normalized binary frequencies of binaries with high- (thin lines) and low-mass (thick lines) primaries with time. Panel c) evolution of the difference of the binary frequency of high- and low-mass stars with time. The difference at each time-step has been reduced by the initial difference of the binary frequencies to improve the readability. Crosses, stars, open, and filled squares denote simulations with initially 30%, 50%, 75%, and 100% binaries, respectively.
Current usage metrics show cumulative count of Article Views (full-text article views including HTML views, PDF and ePub downloads, according to the available data) and Abstracts Views on Vision4Press platform.
Data correspond to usage on the plateform after 2015. The current usage metrics is available 48-96 hours after online publication and is updated daily on week days.
Initial download of the metrics may take a while.