Fig. 6
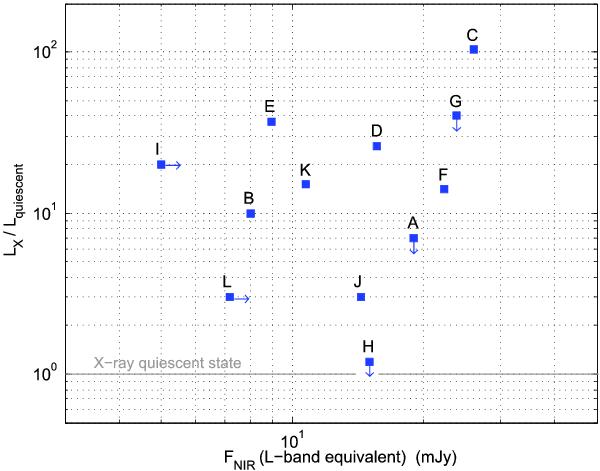
Relation between the X-ray and NIR peak fluxes of all the flares so far covered with multi-wavelength observations. See Table 2 for details about each individual flare. Events A and B are the ones reported in this work. X-ray upper limits and NIR lower limits are indicated by down pointing and right pointing arrows, respectively.
Current usage metrics show cumulative count of Article Views (full-text article views including HTML views, PDF and ePub downloads, according to the available data) and Abstracts Views on Vision4Press platform.
Data correspond to usage on the plateform after 2015. The current usage metrics is available 48-96 hours after online publication and is updated daily on week days.
Initial download of the metrics may take a while.