| Issue |
A&A
Volume 528, April 2011
|
|
|---|---|---|
| Article Number | A55 | |
| Number of page(s) | 6 | |
| Section | Stellar structure and evolution | |
| DOI | https://doi.org/10.1051/0004-6361/201014837 | |
| Published online | 01 March 2011 | |
Spin down during quiescence of the fastest known accretion-powered pulsar
1
Dipartimento di FisicaUniversitá degli Studi di Cagliari,
SP Monserrato-Sestu, KM 0.7,
09042
Monserrato,
Italy
e-mail: This email address is being protected from spambots. You need JavaScript enabled to view it.
2 INAF - Osservatorio Astronomico di Cagliari, Poggio dei Pini,
Strada 54, 09012 Capoterra (CA), Italy
3
Dipartimento di Scienze Fisiche ed Astronomiche, Universitá di
Palermo, via Archirafi
36, 90123
Palermo,
Italy
Received:
21
April
2010
Accepted:
20
January
2011
Abstract
We present a timing solution for the 598.89 Hz accreting millisecond pulsar, IGR J00291+5934, using Rossi X-ray Timing Explorer data
taken during the two outbursts exhibited by the source on 2008 August and September. We
estimate the neutron star spin frequency and we refine the system orbital solution. To
achieve the highest possible accuracy in the measurement of the spin frequency variation
experienced by the source in-between the 2008 August outburst and the last outburst
exhibited in 2004, we re-analysed the latter considering the whole data set available. We
find that the source spins down during quiescence at an average rate of
 Hz s-1.
We discuss possible scenarios that can account for the long-term neutron star spin-down in
terms of either magneto-dipole emission, emission of gravitational waves, and a propeller
effect. If interpreted in terms of magneto-dipole emission, the measured spin down
translates into an upper limit to the neutron star magnetic field,
B ≲ 3 × 10⁸ G, while an upper limit to the average neutron
star mass quadrupole moment of Q ≲ 2 × 1036 g cm2
is set if the spin down is interpreted in terms of the emission of gravitational
waves.
Hz s-1.
We discuss possible scenarios that can account for the long-term neutron star spin-down in
terms of either magneto-dipole emission, emission of gravitational waves, and a propeller
effect. If interpreted in terms of magneto-dipole emission, the measured spin down
translates into an upper limit to the neutron star magnetic field,
B ≲ 3 × 10⁸ G, while an upper limit to the average neutron
star mass quadrupole moment of Q ≲ 2 × 1036 g cm2
is set if the spin down is interpreted in terms of the emission of gravitational
waves.
Key words: gravitational waves / stars: neutron / stars: rotation / pulsars: individual: IGR J00291+5934 / X-rays: binaries
© ESO, 2011
1. Introduction
The discovery of the first accreting millisecond pulsar (AMSP) in 1998, SAX J1808.4–3658 (Wijnands & van der Klis 1998), confirmed the predictions of the recycling scenario, according to which millisecond radio pulsars are the end product of a long phase of accretion of matter and angular momentum onto a neutron star (NS) hosted in a low mass X-ray binary (see, e.g., Bhattacharya & van den Heuvel 1991). In the twelve years since the first discovery, the class of AMSPs has grown to thirteen members, all X-ray transients. To perform a timing analysis of different outbursts of the same source allows the estimate of its evolution over a time range of a few years. In the case of SAX J1808.4–3658, the observations of five outbursts over 10 yr have allowed a firm estimate of its spin and orbital evolution. The orbital period has been observed to increase at a rate of nearly two orders of magnitude larger than what is predicted by conservative mass transfer (Di Salvo et al. 2008; Burderi et al. 2009; see also Hartman et al. 2008, H08 hereafter). This has led the authors to argue that a large fraction of the mass transferred by the companion star is ejected by the system taking away the angular momentum needed to match the observed value. A regular NS spin down has also been measured by H08 (see also Hartman et al. 2009) leading to stringent upper limits on the various mechanisms that can brake down a pulsar during quiescence such as magneto-dipole emission, emission of gravitational waves and a propeller effect. These effects, and in particular the spin down torque associated with the emission of gravitational waves, NGW, crucially depend on the spin frequency of the NS (NGW ∝ ν5). It is therefore very appealing to shed light on the long-term behaviour of the fastest AMSP discovered so far, the 598.89 Hz pulsar IGR J00291+5934 (J00291 in the following). In this paper, we present a timing analysis based on the two outbursts shown by the source in 2008, and observed by the Rossi X-ray Timing Explorer (RXTE). The results thus obtained are compared with the rotational state of J00291 at the end of the outburst exhibited on 2004 December, that is the only other outburst of this source for which high temporal resolution data are available.
2. Observations
The X-ray transient, J00291, was discovered by INTEGRAL on 2004 December 2 (Shaw et al. 2005). The 598.89 Hz pulsations found in its light curve make it the fastest AMSP discovered so far (Galloway et al. 2005, G05 hereinafter).
Renewed activity was detected by RXTE on 2008 August 13 (Chakrabarty et al. 2008). The 2.5–25 keV X-ray flux1 reaches a peak level of (6.3 ± 0.2) × 10-10 erg cm-2 s-1, which is ≈ 0.5 times the peak flux observed during the 2004 outburst (G05). The flux decreases on a timescale τ ≈ 3 d and the source returns to quiescence ~5 d after the first detection. The light curve recorded by the PCU2 of the Proportional Counter Array (PCA) aboard RXTE is plotted in Fig. 1. As the nearby source V709 Cas (17 arcmin away) contributes to the X-ray flux detected by RXTE in the direction of J00291 (Markwardt & Swank 2008), the observed count-rate stays at a level of ~6 c s-1 PCU-1 (corresponding to (7 ± 2) × 10-11 erg cm-2 s-1; 2.5–25 keV) even when the J00291 outburst is presumably over. J00291 is again detected in outburst on 2008 September, 21 and the fluence of this second episode is similar to that of the first one.
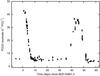 |
Fig. 1 Lightcurve of the two outbursts exhibited by J00291 during 2008, as observed by the PCU2 of the PCA aboard RXTE. |
To perform a timing analysis on the 598.89 Hz pulsar signal, we consider events recorded by
the PCA (Obsid P93013) both in good xenon (1 μs temporal resolution), and
event mode (125 μs temporal resolution) configurations. All the arrival
times were first corrected with respect to the Solar System barycentre, considering the
position of the optical counterpart determined by Torres
et al. (2008, T08 hereinafter), RA =
00h29m03 05 ±
001,
Dec = 59°34′18
05 ±
001,
Dec = 59°34′18 93 ±
005.
A re-analysis of the data taken by RXTE during the 2004 outburst (ObsId
P90052 and P90425), is also reported. Despite a temporal analysis of the 2004 outburst of
J00291 having already been performed by G05, Falanga et al.
(2005, F05 in the following) and Burderi et al.
(2007, B07), such a re-analysis is aimed at deriving the most accurate estimate of
the spin frequency at the end of the outburst that can then be compared to the spin
frequency of the source measured in 2008, after ≈ 3.7 yr of quiescence.
93 ±
005.
A re-analysis of the data taken by RXTE during the 2004 outburst (ObsId
P90052 and P90425), is also reported. Despite a temporal analysis of the 2004 outburst of
J00291 having already been performed by G05, Falanga et al.
(2005, F05 in the following) and Burderi et al.
(2007, B07), such a re-analysis is aimed at deriving the most accurate estimate of
the spin frequency at the end of the outburst that can then be compared to the spin
frequency of the source measured in 2008, after ≈ 3.7 yr of quiescence.
3. Temporal analysis
3.1. The 2008 outbursts
To check the presence of pulsations during the 2008 outbursts of J00291, we first correct
the photon-arrival times for the source orbital motion. As no eccentricity was detected as
a result of the timing analysis performed on the data of the 2004 outburst (G05, see also
Sect. 3.2), we consider a circular orbit to correct
photon-arrival times,
tem − tarr = xsin [l(tem)] .
Here tarr and tem are the photon
arrival and emission times, respectively,
x = asini/c the
projected semi-major axis of the NS orbit,
l(tem) = 2π(tem − T∗)/Porb
is the mean orbital longitude, Porb the orbital period,
and T∗ the epoch at which the mean orbital longitude is
equal to zero (see Deeter et al. 1981, for a
discussion of this choice of orbital epoch2). After a
set of values for the orbital parameters is considered, the corrected emission times are
obtained by iterating the above relation until the difference between successive steps is
of the order of the RXTE absolute timing accuracy (3.4 μs, Jahoda et al. 2006). We first consider the values
of x and Porb given by G05 as orbital
evolution is not expected to change them significantly during the time elapsed between the
2004 and 2008 outbursts (≈3.7 yr). The propagation of the error in the value
of T∗ quoted by G05 yields instead an uncertainty of
~ 80 s. We then use the technique described by Papitto et al. (2005) to improve the estimate
of T∗. The difference of ≃ − 200 s between the improved
estimate we find and the value predicted according to the G05 solution indicates how a
correction of ≃ − 0.015 s (2.5σ from the G05 estimate) to the value of
the orbital period has to be applied. Using this improved orbital solution and folding
500 s-long data segments in 12 phase bins around the frequency
 Hz, we detect
pulsations at the 99% confidence level in the interval MJD 54 691.9−54 696.8, which we
refer to as the 2008 August outburst. Pulses are again detected in the interval MJD
54 730.5−54 740.1 (2008 September outburst), after observations have been folded around
the frequency
Hz, we detect
pulsations at the 99% confidence level in the interval MJD 54 691.9−54 696.8, which we
refer to as the 2008 August outburst. Pulses are again detected in the interval MJD
54 730.5−54 740.1 (2008 September outburst), after observations have been folded around
the frequency  Hz. A detection is
assessed according to the criterion stated by Leahy et al.
(1983), rejecting the profiles that have a probability larger than 1% of being
due to chance.
Hz. A detection is
assessed according to the criterion stated by Leahy et al.
(1983), rejecting the profiles that have a probability larger than 1% of being
due to chance.
Spin and orbital parameters of J00291.
The pulse profiles have an rms amplitude of ≃ 8% and are successfully modelled by a
sinusoid. We fit the phases thus evaluated with the relation  (1)where Tref
is the reference epoch for the timing solution, ν0
and
(1)where Tref
is the reference epoch for the timing solution, ν0
and  are the pulsar frequency at the reference epoch and its mean derivative across the
outburst, respectively, and Rorb(t) describes
the phase residuals due to a difference between the parameters used to correct photon
arrival times and the actual orbital parameters of the system. Neglecting second-order
terms in the eccentricity, these residuals behave
as
are the pulsar frequency at the reference epoch and its mean derivative across the
outburst, respectively, and Rorb(t) describes
the phase residuals due to a difference between the parameters used to correct photon
arrival times and the actual orbital parameters of the system. Neglecting second-order
terms in the eccentricity, these residuals behave
as![Mathematical equation: \begin{eqnarray} R_{\rm orb}(t) & = & x \nu_f \left\{ \sin{[l(t)]}\frac{\delta x}{x} -\frac{1}{P_{\rm orb}} \left[l(t)\;\delta P_{\rm orb} + 2\pi\; \delta T^*\right]\cos{[l(t)]} \right. \nonumber \\[1.5mm] &&\left. + \frac{1}{2}\sin{[2l(t)]} h - \frac{1}{2}\cos{[2l(t)]}g \right \}, \end{eqnarray}](/articles/aa/full_html/2011/04/aa14837-10/aa14837-10-eq61.png) (2)where
h = ecosω and
g = esinω, e is the
eccentricity of the orbit, ω the longitude of the periastron measured
from the ascending node, and the terms δx,
δPorb, and
δT∗ are the differential corrections to
the respective orbital parameter with respect to those used to correct the time series. If
significant corrections to the orbital parameters are found, photon arrival times are
corrected with the new set of orbital parameters and the phases thus obtained are again
fitted using Eq. (1). This procedure is
iterated until no orbital residuals are significantly detected.
(2)where
h = ecosω and
g = esinω, e is the
eccentricity of the orbit, ω the longitude of the periastron measured
from the ascending node, and the terms δx,
δPorb, and
δT∗ are the differential corrections to
the respective orbital parameter with respect to those used to correct the time series. If
significant corrections to the orbital parameters are found, photon arrival times are
corrected with the new set of orbital parameters and the phases thus obtained are again
fitted using Eq. (1). This procedure is
iterated until no orbital residuals are significantly detected.
The results we obtain by fitting the phases of the two outbursts separately are given in
the leftmost and central column of Table 1. We
consider either a constant frequency model (i.e.,  )
and also allow for the possibility of a constant spin frequency derivative during each of
the outbursts (
)
and also allow for the possibility of a constant spin frequency derivative during each of
the outbursts ( model). The addition of a quadratic component to the fit of 2008 August and 2008 September
data does not significantly improve the model, and only an upper limit could be set on the
spin up term during both outbursts. However, the results obtained with this model are
considered as more reliable than those obtained putting
,
as a non-zero spin frequency derivative is expected on physical grounds and also already
observed during the outburst shown by the source during 2004 (F05 and B07; see also
Sect. 3.2). We note however that the spin frequency
determined in the case
is compatible within a 3σ confidence level with that obtained allowing
,
thus representing a particular case of this more general solution. The evolution of the
phases determined for the 2008 August and September outbursts are plotted in Figs. 2 and 3,
respectively, together with the residuals with respect to the best-fit
model). The addition of a quadratic component to the fit of 2008 August and 2008 September
data does not significantly improve the model, and only an upper limit could be set on the
spin up term during both outbursts. However, the results obtained with this model are
considered as more reliable than those obtained putting
,
as a non-zero spin frequency derivative is expected on physical grounds and also already
observed during the outburst shown by the source during 2004 (F05 and B07; see also
Sect. 3.2). We note however that the spin frequency
determined in the case
is compatible within a 3σ confidence level with that obtained allowing
,
thus representing a particular case of this more general solution. The evolution of the
phases determined for the 2008 August and September outbursts are plotted in Figs. 2 and 3,
respectively, together with the residuals with respect to the best-fit
 models.
 |
Fig. 2 Evolution of the pulse phase delays (in μs) during the August 2008
outburst obtained by folding around the best estimate of the spin frequency at the
beginning of that outburst, |

 |
Fig. 3 Same as Fig. 2 concerning the phases of the
2008 September outburst. Observations were folded around the best estimate of the
spin frequency at the beginning of that outburst,
|
3.2. The 2004 outburst
This work is mainly focused on the study of the spin down experienced by J00291 during
the quiescent phase that lasted since the end of the 2004 outburst to the onset of the
2008 August outburst. To this aim, the most accurate estimate of the spin frequency at the
end of the 2004 outburst is needed. Previous works relied only on a fraction of the
available data: G05 considered only the first three days of data, ObsId P90052, while the
solutions of F05 and B07 are valid for the subsequent seven days, ObsId P90425, the only
set of which data were publicly available at that time. We re-analysed the 2004 outburst
including all the available RXTE data (ObsId P90052 and P90425). Time
series were corrected using the position of the optical counterpart (T08), while the
position of the proposed radio counterpart (Rupen et al.
2004) was considered in previous works. The results we obtained, applying the
same procedure outlined in Sect. 3.1, are listed in
the rightmost column of Table 1. Only the parabolic
model
is presented because the quadratic term is highly significant
(Δχ2 = 303 over 429 degrees of freedom with respect to a
constant frequency model, which has one degree of freedom more). The timing solution is
referred to an epoch at the end of the outburst to estimate the spin frequency after the
accretion-induced spin-up is over, which can therefore be compared to the frequency at the
beginning of the 2008 August outburst. The orbital parameters we obtain are compatible
with those previously published by G05, F05, and B07, and are somewhat more precise as
they rely on a longer baseline. The addition of three days of data to the data set
considered by F05 and B07 indicates an average spin-up term
![Mathematical equation: \hbox{$[\dot{\nu}_{04}=(+5.1\,\pm\,0.3)\times10^{-15}~{\rm Hz\,s}^{-1}]$}](/articles/aa/full_html/2011/04/aa14837-10/aa14837-10-eq71.png) ,
which is lower with respect to those there evaluated
[(8.5 ± 1.1) × 10-15 Hz s-1] . The phase evolution
and residuals with respect to the best-fit model are plotted in Fig. 4.
,
which is lower with respect to those there evaluated
[(8.5 ± 1.1) × 10-15 Hz s-1] . The phase evolution
and residuals with respect to the best-fit model are plotted in Fig. 4.
 |
Fig. 4 Same as Figs. 2 and 3 concerning the phases of the 2004 outburst. The timing solution
has been refereed to the epoch at the end of the outburst, MJD 53 352.0, to get the
most precise estimate of the spin frequency at that epoch,
|
3.3. The positional uncertainty
The uncertainties quoted in Table 1
are 1σ error based on the modelling of the phase evolution. However,
the error in the source position introduces an uncertainty in the determination of the
pulse phases ![Mathematical equation: \begin{equation} \Delta\phi_{\rm pos} = \nu y \left[\sin\left(M_0 + \epsilon\right) \cos\beta\delta{\lambda} - \cos\left(M_0 + \epsilon\right)\sin\beta\delta{\beta}\right], \end{equation}](/articles/aa/full_html/2011/04/aa14837-10/aa14837-10-eq74.png) (3)where
y is the Earth distance from the Solar System barycentre in lt-s,
λ and β are the ecliptic longitude and latitude,
respectively, δλ and δβ the respective uncertainties,
M0 = [2π(T0 − Tγ)/P ⊕ ] − λ,
T0 is the start time of observations considered,
Tγ is the nearest epoch of passage at the
vernal point, P ⊕ is the Earth orbital period, and
ϵ = 2π(t − T0)/P ⊕
(see, e.g., Lyne & Graham-Smith 1990). For
time intervals that are small with respect to the Earth orbital period (i.e.
ϵ ≪ 1) such as the ones considered in this work, this expression can be
expanded as a polynomial and only the lowest order terms retained. As the value of the
spin frequency at the reference epoch of the timing solution depends on the linear term of
the temporal evolution of the phases [see Eq. (1)], the systematic uncertainty introduced by the position error in this
measure, δνpos, is
(3)where
y is the Earth distance from the Solar System barycentre in lt-s,
λ and β are the ecliptic longitude and latitude,
respectively, δλ and δβ the respective uncertainties,
M0 = [2π(T0 − Tγ)/P ⊕ ] − λ,
T0 is the start time of observations considered,
Tγ is the nearest epoch of passage at the
vernal point, P ⊕ is the Earth orbital period, and
ϵ = 2π(t − T0)/P ⊕
(see, e.g., Lyne & Graham-Smith 1990). For
time intervals that are small with respect to the Earth orbital period (i.e.
ϵ ≪ 1) such as the ones considered in this work, this expression can be
expanded as a polynomial and only the lowest order terms retained. As the value of the
spin frequency at the reference epoch of the timing solution depends on the linear term of
the temporal evolution of the phases [see Eq. (1)], the systematic uncertainty introduced by the position error in this
measure, δνpos, is ![Mathematical equation: \begin{equation} \label{eq:errpos} \delta\nu_{\rm pos}\simeq \nu \;y \left(\frac{2\pi}{P_{\oplus}}\right) \left[\cos{M_0}\;\cos{\beta}\;\delta\lambda+\sin{M_0}\;\sin{\beta}\;\delta\beta\right]. \end{equation}](/articles/aa/full_html/2011/04/aa14837-10/aa14837-10-eq87.png) (4)Considering the
uncertainties in the position quoted by T08
[σλ ≤ (3.9 × 10⁻⁵)°,
σβ ≤ (2.4 × 10⁻⁵)°], and
evaluating this relation for the 2008 and the 2004 outbursts translates into
(4)Considering the
uncertainties in the position quoted by T08
[σλ ≤ (3.9 × 10⁻⁵)°,
σβ ≤ (2.4 × 10⁻⁵)°], and
evaluating this relation for the 2008 and the 2004 outbursts translates into
 Hz
and
Hz
and  Hz,
respectively. To get reliable estimates of the uncertainties affecting each measured spin
frequency, these systematic errors have to be summed in quadrature with the statistical
errors quoted in Table 1. The systematic error in
the frequency variation between the two outbursts can instead be estimated as
σΔνpos ≃ 4 × 10⁻⁸ Hz.
Hz,
respectively. To get reliable estimates of the uncertainties affecting each measured spin
frequency, these systematic errors have to be summed in quadrature with the statistical
errors quoted in Table 1. The systematic error in
the frequency variation between the two outbursts can instead be estimated as
σΔνpos ≃ 4 × 10⁻⁸ Hz.
3.4. The spin evolution of J00291 during quiescence
The estimate of the spin frequency of J00291 at the beginning of the 2008 August can be
compared with the spin measured at the end of the 2004 outburst to measure the frequency
variation experienced by the source during quiescence. Considering the value measured
using the
model at the onset of the 2008 August outburst
(νA08 = 598.89213046(13) Hz), we thus obtain
Δν = νA08 − ν04 = −(0.48 ± 0.13 ± 0.04) μHz,
where the first error quoted is the statistical error given by the difference of the
values quoted in Table 1 and the latter reflects
the uncertainty on the source position. The average spin-down rate during quiescence is
therefore estimated as  Hz s-1.
The large uncertainty affecting this estimate is due to the limited statistics available
for the 2008 August outburst which imply loose estimates of the spin frequency at the
beginning of that outburst and of the spin frequency derivative during that outburst (see
also the discussion).
Hz s-1.
The large uncertainty affecting this estimate is due to the limited statistics available
for the 2008 August outburst which imply loose estimates of the spin frequency at the
beginning of that outburst and of the spin frequency derivative during that outburst (see
also the discussion).
4. Discussion and conclusions
We have presented a detailed timing analysis concerning the two outbursts shown by J00291 in 2008 August and September as observed by RXTE, as well as a re-analysis of the 2004 outburst using the whole RXTE dataset available.
Our analysis of the 2004 data confirms the significant spin up the source has underwent
while accreting as already reported by F05 and B07. The estimate of the spin up rate we have
presented here ![Mathematical equation: \hbox{$[\dot{\nu}_{04}=(+5.1\pm0.3)\times10^{-13}~{\rm Hz\,s}^{-1}]$}](/articles/aa/full_html/2011/04/aa14837-10/aa14837-10-eq96.png) is evaluated on a longer temporal baseline with respect to that considered by those authors
and is accordingly more accurate. The magnitude of the spin up is lower by a factor
~ 0.4 with respect to that quoted by those works, making its interpretation easier
in terms of the NS accretion of the supposedly Keplerian disc angular momentum at the flux
emitted by the source (see discussion in B07).
is evaluated on a longer temporal baseline with respect to that considered by those authors
and is accordingly more accurate. The magnitude of the spin up is lower by a factor
~ 0.4 with respect to that quoted by those works, making its interpretation easier
in terms of the NS accretion of the supposedly Keplerian disc angular momentum at the flux
emitted by the source (see discussion in B07).
In contrast, no derivative is detected significantly during the 2008, August and September,
outbursts, with 3σ upper limits on the spin up component of
 and
and  Hz s-1,
respectively. These estimates reflect the limited statistics available. An accretion-induced
spin-up is expected to depend almost linearly on the mass accretion rate
(
Hz s-1,
respectively. These estimates reflect the limited statistics available. An accretion-induced
spin-up is expected to depend almost linearly on the mass accretion rate
( ,
where α is the index of the dependence of the inner disk radius on the
mass accretion rate,
Rin ∝ Ṁ − α,
α = 2/7 if the inner disc radius is approximated by the Alfven radius).
As the peak X-ray flux shown by the source during both 2008 outbursts is roughly half that
of the 2004 outburst, the spin up rate is expected to scale accordingly, provided that the
flux is a good tracer of the mass accretion rate. We thus expect
,
where α is the index of the dependence of the inner disk radius on the
mass accretion rate,
Rin ∝ Ṁ − α,
α = 2/7 if the inner disc radius is approximated by the Alfven radius).
As the peak X-ray flux shown by the source during both 2008 outbursts is roughly half that
of the 2004 outburst, the spin up rate is expected to scale accordingly, provided that the
flux is a good tracer of the mass accretion rate. We thus expect
 Hz s-1
during each of the outbursts shown by the source in 2008. While the upper limit to the
September 2008 outburst spin up is of the same order as this value, the upper limit to the
August 2008 data is one order of magnitude larger and can therefore not be considered as a
tight constraint. This can also be viewed by considering the 3σ upper limit
to the difference between the spin frequencies at the beginning of the 2008 September and
August outbursts,
νS08 − νA08 < 0.45 μHz.
Neglecting any spin down in-between the two outbursts, the spin up during the 2008 August
episode cannot be larger than
Hz s-1
during each of the outbursts shown by the source in 2008. While the upper limit to the
September 2008 outburst spin up is of the same order as this value, the upper limit to the
August 2008 data is one order of magnitude larger and can therefore not be considered as a
tight constraint. This can also be viewed by considering the 3σ upper limit
to the difference between the spin frequencies at the beginning of the 2008 September and
August outbursts,
νS08 − νA08 < 0.45 μHz.
Neglecting any spin down in-between the two outbursts, the spin up during the 2008 August
episode cannot be larger than  Hz s-1
to account for this difference. This reasonable upper limit is already smaller by a factor
of two than the upper limit found from timing analysis of that outburst alone.
Hz s-1
to account for this difference. This reasonable upper limit is already smaller by a factor
of two than the upper limit found from timing analysis of that outburst alone.
The comparison of the spin frequency measured at the beginning of the 2008 August outburst
with that of the end of the 2004 episode indicates that the spin frequency has decreased
during quiescence. Summing in quadrature the statistical error to the systematics induced by
the uncertainty in the source position (see Sect. 3.4),
we quote an average spin-down rate during quiescence of
Hz s-1.
A spin down at a rate of (−5.5 ± 1.2) × 10-16 Hz s-1 extending over
~ 10 yr, has already been measured by Hartman et al. (2009; see also H08), from the 401 Hz AMSP, SAX J1808.4–3658. Riggio et al. (in prep.) found an average spin down rate of
(−5.5 ± 1.2) × 10-15 Hz s-1 for the case of XTE J1751–305, while only an upper limit
( Hz s-1,
95% confidence level) could be set instead by Patruno et al.
(2010), for SWIFT J1756.9–2508. Similarly
to H08, we discuss the spin down measured from J00291 in terms of: (i) magneto-dipole
radiation, (ii) emission of gravitational waves, and (iii) the propeller effect.
Hz s-1,
95% confidence level) could be set instead by Patruno et al.
(2010), for SWIFT J1756.9–2508. Similarly
to H08, we discuss the spin down measured from J00291 in terms of: (i) magneto-dipole
radiation, (ii) emission of gravitational waves, and (iii) the propeller effect.
The spin down luminosity of a rotating magnetosphere,
 ,
has been evaluated by Spitkovsky (2006) in the limit
of force-free magneto-hydrodynamics as,
Lsd = (1 + sin2α)μ2(2πν)4/c3,
where α is the latitude of the magnetic poles, I is the
NS moment of inertia and μ is the magnetic dipole. This translates into a
spin down rate,
,
has been evaluated by Spitkovsky (2006) in the limit
of force-free magneto-hydrodynamics as,
Lsd = (1 + sin2α)μ2(2πν)4/c3,
where α is the latitude of the magnetic poles, I is the
NS moment of inertia and μ is the magnetic dipole. This translates into a
spin down rate, ![Mathematical equation: \hbox{$\dot{\nu}_{\rm sd}=L_{\rm sd}/(4\pi^2 I \nu)= [3(1+\sin^2{\alpha})/(2\sin^2{\alpha})] (N_{\rm vac}/2\pi I)$}](/articles/aa/full_html/2011/04/aa14837-10/aa14837-10-eq114.png) ,
where
Nvac = −(2/3)μ2(2πν/c)3sin2α
is the usual expression for the torque acting on a magnetised rotator in vacuum. The
estimate of
,
where
Nvac = −(2/3)μ2(2πν/c)3sin2α
is the usual expression for the torque acting on a magnetised rotator in vacuum. The
estimate of  we have given translates into a value of the magnetic dipole of
 G cm3,
where I45 is the moment of inertia in units of
1045 g cm2. This estimates translates into a magnetic field,
G cm3,
where I45 is the moment of inertia in units of
1045 g cm2. This estimates translates into a magnetic field,
 G at
the magnetic poles of a 10 km NS. Considering α = 0, an upper limit of
≃ 3 × 10⁸ G (3σ confidence level) on the magnetic field is
obtained. This estimate fits well into the expected range of magnetic field strengths for
the AMSPs to be the progenitors of recycled radio millisecond pulsars
( ≃ 108 − 109 G). It is also compatible with the requirements set on
the dipole strength by the maximum and minimum accretion rate experienced by the source
while showing pulsations. For pulsations to be observed, the magnetospheric radius has to
lie between the NS radius, RNS, and the corotation radius,
RC = (GM/4π2ν2)1/3
(
G at
the magnetic poles of a 10 km NS. Considering α = 0, an upper limit of
≃ 3 × 10⁸ G (3σ confidence level) on the magnetic field is
obtained. This estimate fits well into the expected range of magnetic field strengths for
the AMSPs to be the progenitors of recycled radio millisecond pulsars
( ≃ 108 − 109 G). It is also compatible with the requirements set on
the dipole strength by the maximum and minimum accretion rate experienced by the source
while showing pulsations. For pulsations to be observed, the magnetospheric radius has to
lie between the NS radius, RNS, and the corotation radius,
RC = (GM/4π2ν2)1/3
( km for
J00291, where m1.4 is the NS mass in units of
1.4 M⊙). The minimum flux at which we observe pulsations
during the 2008 outbursts is
F2.5−25 = (1.8 ± 0.4) × 10-10 erg cm2 s-1
(MJD 54 696.751). Assuming as the bolometric correction factor that derived by G05 (2.54)
and that the observed X-ray flux reflects the mass accretion rate, this translates into
km for
J00291, where m1.4 is the NS mass in units of
1.4 M⊙). The minimum flux at which we observe pulsations
during the 2008 outbursts is
F2.5−25 = (1.8 ± 0.4) × 10-10 erg cm2 s-1
(MJD 54 696.751). Assuming as the bolometric correction factor that derived by G05 (2.54)
and that the observed X-ray flux reflects the mass accretion rate, this translates into
 ,
where R10 is the radius of the NS in units of 10 km,
and d4 is the distance to the source in units of 4 kpc.
Considering the value quoted by G05 for the peak flux during the 2004 outburst, the maximum
accretion rate at which pulsations were observed can be estimated as
,
where R10 is the radius of the NS in units of 10 km,
and d4 is the distance to the source in units of 4 kpc.
Considering the value quoted by G05 for the peak flux during the 2004 outburst, the maximum
accretion rate at which pulsations were observed can be estimated as
 .
Using the expressions derived by Psaltis &
Chakrabarty (1999), the presence of pulsations at these two limiting accretion
rates indicates that the magnetic dipole has to lie in the range,
(0.2 − 21) × 1026 d4 G cm3, fully
compatible with our estimate. As the minimum flux at which pulsations are observed is likely
overestimated by a factor of ~2 because of the contribution of V709 Cas, the
upper limit to the magnetic dipole is likely to be a
factor
.
Using the expressions derived by Psaltis &
Chakrabarty (1999), the presence of pulsations at these two limiting accretion
rates indicates that the magnetic dipole has to lie in the range,
(0.2 − 21) × 1026 d4 G cm3, fully
compatible with our estimate. As the minimum flux at which pulsations are observed is likely
overestimated by a factor of ~2 because of the contribution of V709 Cas, the
upper limit to the magnetic dipole is likely to be a
factor  smaller. Considering also the dynamical estimate of the maximum mass-accretion rate derived
by B07 from the spin up rate observed during the 2004 outburst, the lower limit to the
dipole strength increases to 0.6 × 1026 G cm-3, still compatible with
the estimate derived here. Our estimate of the magnetic field strength is also compatible
with the upper limit estimated by T08 from the X-ray quiescent luminosity,
< 3 × 10⁸ G, using the criteria stated by Burderi et al. (2002) and Di Salvo
& Burderi (2003).
smaller. Considering also the dynamical estimate of the maximum mass-accretion rate derived
by B07 from the spin up rate observed during the 2004 outburst, the lower limit to the
dipole strength increases to 0.6 × 1026 G cm-3, still compatible with
the estimate derived here. Our estimate of the magnetic field strength is also compatible
with the upper limit estimated by T08 from the X-ray quiescent luminosity,
< 3 × 10⁸ G, using the criteria stated by Burderi et al. (2002) and Di Salvo
& Burderi (2003).
The spin down torque associated with the emission of gravitational radiation has been
proposed to explain the non-detection of accreting pulsars with frequencies higher than
≈ 730 Hz (Chakrabarty et al. 2003; see Wagoner 1984; Bildsten
1998; Melatos & Payne 2005, for
models describing mechanism that can lead to a non-zero mass quadrupole for an accreting
pulsar). In this case, the spin-down torque is,
NGW = −(32/5)
GQ2(2πν/c)5
(see, e.g., Thorne 1980). Under the hypotheses that
the spin down of J00291 is due only to this mechanism and that the torque due to the GW
emission is constant, our measure of the average spin down translates into an estimate of
the average mass quadrupole moment,  g cm2.
Considering the upper limit at the 3σ confidence level,
Q ≲ 2 × 1036 g cm2, the maximum amplitude at the
Earth of the emitted GW is therefore,
g cm2.
Considering the upper limit at the 3σ confidence level,
Q ≲ 2 × 1036 g cm2, the maximum amplitude at the
Earth of the emitted GW is therefore,  (Brady et al. 1998). Assuming that the spin down
during quiescence of J00291 and SAX J1808.4–3658 is
driven by the emission of GW and that the NS in these systems have a similar mass
quadrupole, the spin down driven by the emission of GW should be
≈ (598.9/401.0)5 ≃ 7.6 times larger in J00291 than in SAX J1808.4–3658. The large uncertainties affecting the
spin down estimates in both sources do not allow us to check whether this prediction is
compatible with observations. However, that the spin down of both sources can be easily
explained by magneto-dipole emission of a NS with a magnetic field of the order of that
expected for an AMSP makes it unlikely that the spin down during quiescence of AMSPs is
dictated by the emission of GW.
(Brady et al. 1998). Assuming that the spin down
during quiescence of J00291 and SAX J1808.4–3658 is
driven by the emission of GW and that the NS in these systems have a similar mass
quadrupole, the spin down driven by the emission of GW should be
≈ (598.9/401.0)5 ≃ 7.6 times larger in J00291 than in SAX J1808.4–3658. The large uncertainties affecting the
spin down estimates in both sources do not allow us to check whether this prediction is
compatible with observations. However, that the spin down of both sources can be easily
explained by magneto-dipole emission of a NS with a magnetic field of the order of that
expected for an AMSP makes it unlikely that the spin down during quiescence of AMSPs is
dictated by the emission of GW.
The spin down of an accreting NS during quiescence can be also explained by the propeller
effect (Illarionov & Sunyaev 1975), that is
the centrifugal inhibition of accretion by a magnetosphere that extends beyond the
corotation radius. Considering the upper limit at 3σ on the average spin
frequency derivative during quiescence that we have measured
 ,
the system should eject matter at an average rate
Ṁej ≳ 2 × 10-12 n-1
,
the system should eject matter at an average rate
Ṁej ≳ 2 × 10-12 n-1 ,
if the spin down is explained in terms of the propeller effect alone. Here,
Rin is the inner disc radius, and n is the
dimensionless torque (Ghosh & Lamb 1979),
which takes values n ≈ 1, as soon as
rin ≳ RC (Ekşi et al. 2005). Assuming that mass is propelled away from the NS at a
roughly constant rate, the source quiescent luminosity would then be
Lp ≥ GMṀej/2RC ≃ 6 × 1033 erg s-1.
As the quiescent flux received from the source is
Fq ≲ 1.2 × 10⁻¹³ erg cm-2 s-1
(0.5–10 keV, Campana et al. 2008; Jonker et al. 2008), the source should be farther than
≃ 20 kpc to match this value, and a distance greatly in excess of 10 kpc is obviously to be
excluded (see also G05). We thus conclude that it is highly unlikely that the propeller
effect alone explains the spin down of J00291.
,
if the spin down is explained in terms of the propeller effect alone. Here,
Rin is the inner disc radius, and n is the
dimensionless torque (Ghosh & Lamb 1979),
which takes values n ≈ 1, as soon as
rin ≳ RC (Ekşi et al. 2005). Assuming that mass is propelled away from the NS at a
roughly constant rate, the source quiescent luminosity would then be
Lp ≥ GMṀej/2RC ≃ 6 × 1033 erg s-1.
As the quiescent flux received from the source is
Fq ≲ 1.2 × 10⁻¹³ erg cm-2 s-1
(0.5–10 keV, Campana et al. 2008; Jonker et al. 2008), the source should be farther than
≃ 20 kpc to match this value, and a distance greatly in excess of 10 kpc is obviously to be
excluded (see also G05). We thus conclude that it is highly unlikely that the propeller
effect alone explains the spin down of J00291.
Observations of future outbursts from this source will be used to monitor the constancy of the long-term spin down, and to derive tighter constraints on the parameters of the NS in J00291.
The spectrum of J00291, as observed by the PCA aboard RXTE, is evaluated by modelling data recorded by the top layer of the PCU2 with an absorbed power law. We fix the nH to 0.43 × 1022 cm-2 (Paizis et al. 2005). A 6.4 keV iron line is sometimes needed to model the spectrum.
The epoch of passage at the ascending node, Tasc, a fiducial in true longitude that has been widely used in the analysis of AMSPs, is related to T∗ by the relation, Tasc = T∗ + (Porb/π)esinω, where e is the eccentricity and ω is the longitude of periastron measured from the line of nodes (Deeter et al. 1981).
Acknowledgments
This work is supported by the Italian Space Agency, ASI-INAF I/088/06/0 contract for High Energy Astrophysics, as well as by the operating program of Regione Sardegna (European Social Fund 2007-2013), L.R.7/2007, “Promotion of scientific research and technological innovation in Sardinia”. Soon after this paper was first submitted, other two papers discussing the rotational evolution of this source during quiescence appeared on arXiv.org (Patruno 2010; Hartman et al. 2011). Even if the analysis presented by these authors slightly differs with respect to that presented here (in particular Patruno 2010, derived a timing solution under the preliminary assumption that pulse phases linearly correlate with the X-ray flux), the values they obtain for the spin-down rate of the source during quiescence are entirely compatible with that presented here. We thank Jacob M. Hartman for useful discussions and comments on this paper.
References
- Bhattacharya, D., & van den Heuvel, E. P. J. 1991, Phys. Rep., 203, 1 [NASA ADS] [CrossRef] [Google Scholar]
- Bildsten, L. 1998, ApJ, 501, L89 [Google Scholar]
- Brady, P. R., Creighton, T., Cutler, C., & Schutz, B. F. 1998, Phys. Rev. D, 57, 2101 [Google Scholar]
- Burderi, L., Di Salvo, T., Stella, L., et al. 2002, ApJ, 574, 930 [NASA ADS] [CrossRef] [Google Scholar]
- Burderi, L., Di Salvo, T., Lavagetto, G., et al. 2007, ApJ, 657, 961 [NASA ADS] [CrossRef] [Google Scholar]
- Burderi, L., Riggio, A., Di Salvo, T., et al. 2009, A&A, 496, L17 [NASA ADS] [CrossRef] [EDP Sciences] [Google Scholar]
- Campana, S., Stella, L., Israel, G., & D’Avanzo, P. 2008, ApJ, 689, L129 [NASA ADS] [CrossRef] [Google Scholar]
- Chakrabarty, D., Morgan, E. H., Muno, M. P., et al. 2003, Nature, 424, 42 [NASA ADS] [CrossRef] [PubMed] [Google Scholar]
- Chakrabarty, D., Swank, J. H., Markwardt, C. B., & Smith, E. 2008, The Astronomer’s Telegram, 1660, 1 [NASA ADS] [Google Scholar]
- Deeter, J. E., Boynton, P. E., & Pravdo, S. H. 1981, ApJ, 247, 1003 [NASA ADS] [CrossRef] [Google Scholar]
- Di Salvo, T., & Burderi, L. 2003, A&A, 397, 723 [NASA ADS] [CrossRef] [EDP Sciences] [Google Scholar]
- Di Salvo, T., Burderi, L., Riggio, A., et al. 2008, MNRAS, 389, 1851 [NASA ADS] [CrossRef] [Google Scholar]
- Ekşi, K. Y., Hernquist, L., & Narayan, R. 2005, ApJ, 623, L41 [NASA ADS] [CrossRef] [Google Scholar]
- Falanga, M., Kuiper, L., Poutanen, J., et al. 2005, A&A, 444, 15 [NASA ADS] [CrossRef] [EDP Sciences] [Google Scholar]
- Galloway, D. K., Markwardt, C. B., Morgan, E. H., Chakrabarty, D., & Strohmayer, T. E. 2005, ApJ, 622, L45 [NASA ADS] [CrossRef] [Google Scholar]
- Ghosh, P., & Lamb, F. K. 1979, ApJ, 234, 296 [NASA ADS] [CrossRef] [Google Scholar]
- Hartman, J. M., Patruno, A., Chakrabarty, D., et al. 2008, ApJ, 675, 1468 [NASA ADS] [CrossRef] [Google Scholar]
- Hartman, J. M., Patruno, A., Chakrabarty, D., et al. 2009, ApJ, 702, 1673 [NASA ADS] [CrossRef] [Google Scholar]
- Hartman, J. M., Galloway, D. K., & Chakrabarty, D. 2011, ApJ, 726, 26 [NASA ADS] [CrossRef] [Google Scholar]
- Illarionov, A. F., & Sunyaev, R. A. 1975, A&A, 39, 185 [NASA ADS] [Google Scholar]
- Jahoda, K., Markwardt, C. B., Radeva, Y., et al. 2006, ApJS, 163, 401 [NASA ADS] [CrossRef] [Google Scholar]
- Jonker, P. G., Torres, M. A. P., & Steeghs, D. 2008, ApJ, 680, 615 [NASA ADS] [CrossRef] [Google Scholar]
- Leahy, D. A., Darbro, W., Elsner, R. F., et al. 1983, ApJ, 266, 160 [NASA ADS] [CrossRef] [Google Scholar]
- Lyne, A. G., & Graham-Smith, F. 1990, Pulsar astronomy (Cambridge: Cambridge University Press) [Google Scholar]
- Markwardt, C. B., & Swank, J. H. 2008, The Astronomer’s Telegram, 1664, 1 [NASA ADS] [Google Scholar]
- Melatos, A., & Payne, D. J. B. 2005, ApJ, 623, 1044 [NASA ADS] [CrossRef] [Google Scholar]
- Paizis, A., Nowak, M. A., Wilms, J., et al. 2005, A&A, 444, 357 [NASA ADS] [CrossRef] [EDP Sciences] [Google Scholar]
- Papitto, A., Menna, M. T., Burderi, L., et al. 2005, ApJ, 621, L113 [NASA ADS] [CrossRef] [Google Scholar]
- Patruno, A. 2010, ApJ, 722, 909 [NASA ADS] [CrossRef] [Google Scholar]
- Patruno, A., Altamirano, D., & Messenger, C. 2010, MNRAS, 403, 1426 [NASA ADS] [CrossRef] [Google Scholar]
- Psaltis, D., & Chakrabarty, D. 1999, ApJ, 521, 332 [NASA ADS] [CrossRef] [Google Scholar]
- Rupen, M. P., Dhawan, V., & Mioduszewski, A. J. 2004, The Astronomer’s Telegram, 364, 1 [NASA ADS] [Google Scholar]
- Shaw, S. E., Mowlavi, N., Rodriguez, J., et al. 2005, A&A, 432, L13 [NASA ADS] [CrossRef] [EDP Sciences] [Google Scholar]
- Spitkovsky, A. 2006, ApJ, 648, L51 [NASA ADS] [CrossRef] [Google Scholar]
- Thorne, K. S. 1980, Rev. Mod. Phys., 52, 299 [NASA ADS] [CrossRef] [Google Scholar]
- Torres, M. A. P., Jonker, P. G., Steeghs, D., et al. 2008, ApJ, 672, 1079 [NASA ADS] [CrossRef] [Google Scholar]
- Wagoner, R. V. 1984, ApJ, 278, 345 [NASA ADS] [CrossRef] [Google Scholar]
- Wijnands, R., & van der Klis, M. 1998, Nature, 394, 344 [NASA ADS] [CrossRef] [Google Scholar]
All Tables
All Figures
|
Fig. 1 Lightcurve of the two outbursts exhibited by J00291 during 2008, as observed by the PCU2 of the PCA aboard RXTE. |
| In the text | |
|
Fig. 2 Evolution of the pulse phase delays (in μs) during the August 2008
outburst obtained by folding around the best estimate of the spin frequency at the
beginning of that outburst, |
| In the text | |
|
Fig. 3 Same as Fig. 2 concerning the phases of the
2008 September outburst. Observations were folded around the best estimate of the
spin frequency at the beginning of that outburst,
|
| In the text | |
|
Fig. 4 Same as Figs. 2 and 3 concerning the phases of the 2004 outburst. The timing solution
has been refereed to the epoch at the end of the outburst, MJD 53 352.0, to get the
most precise estimate of the spin frequency at that epoch,
|
| In the text | |
Current usage metrics show cumulative count of Article Views (full-text article views including HTML views, PDF and ePub downloads, according to the available data) and Abstracts Views on Vision4Press platform.
Data correspond to usage on the plateform after 2015. The current usage metrics is available 48-96 hours after online publication and is updated daily on week days.
Initial download of the metrics may take a while.