Fig. 5
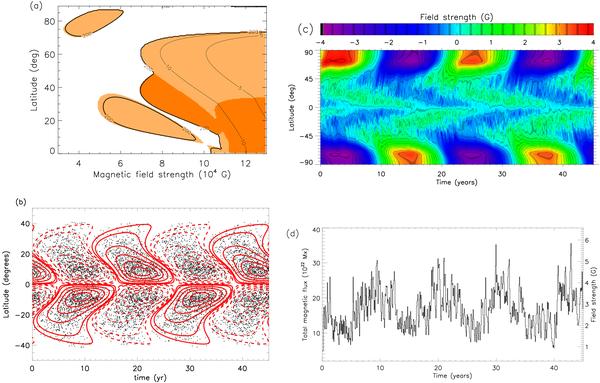
a) Stability diagram for thin magnetic flux tubes in the middle of the solar overshoot region, for Sun-like differential rotation (given by Eq. (23)). White regions represent stable flux tubes, while shaded areas indicate instability. For light-shaded areas, the fastest growing mode has azimuthal wave number m = 1, while for dark-shaded areas it is m = 2. Contours show lines of constant growth times (e-folding times), labelled in units of days. b) Time-latitude diagram of the dynamo-generated mean toroidal magnetic field B(λ,t) at the bottom of the convection zone (contours at ± 0.04, ± 0.1, ± 0.3, ± 0.5, ± 0.7, ± 0.9 of the maximum value of B, solid for positive and dashed for negative values) and of the flux loops emerging at the surface (dots) for a Sun-like star. c) Time-latitude diagram of the longitudinally averaged radial surface magnetic field for the solar model. d) Time variation of the total unsigned surface magnetic flux. The values are averaged over 27-day time intervals.
Current usage metrics show cumulative count of Article Views (full-text article views including HTML views, PDF and ePub downloads, according to the available data) and Abstracts Views on Vision4Press platform.
Data correspond to usage on the plateform after 2015. The current usage metrics is available 48-96 hours after online publication and is updated daily on week days.
Initial download of the metrics may take a while.