Fig. 14
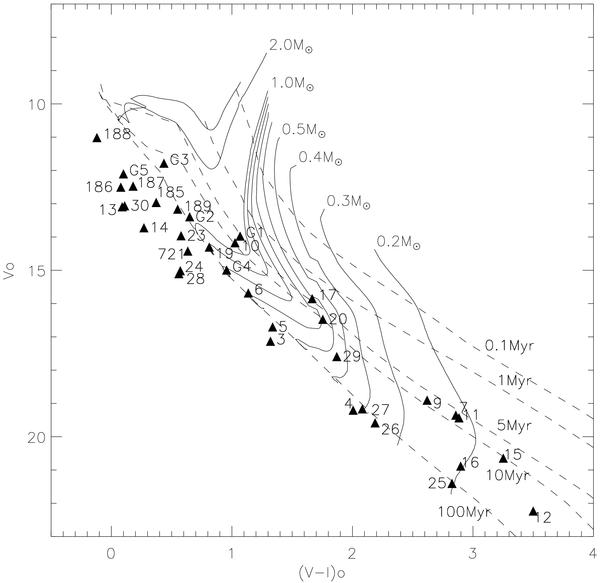
Color–magnitude diagram for the Hα emission-line stars (triangles). An extinction-correction was applied to obtain V0 and (V − I)0 values. The solid lines are evolutionary tracks from D’Antona & Mazzitelli (1997), for masses from 0.2 to 2.0 M⊙ and the dashed lines are their 0.1, 1, 5, 10 and 100 Myr isochrones. The stars are labeled as in Fig. 13.
Current usage metrics show cumulative count of Article Views (full-text article views including HTML views, PDF and ePub downloads, according to the available data) and Abstracts Views on Vision4Press platform.
Data correspond to usage on the plateform after 2015. The current usage metrics is available 48-96 hours after online publication and is updated daily on week days.
Initial download of the metrics may take a while.