Fig. 3
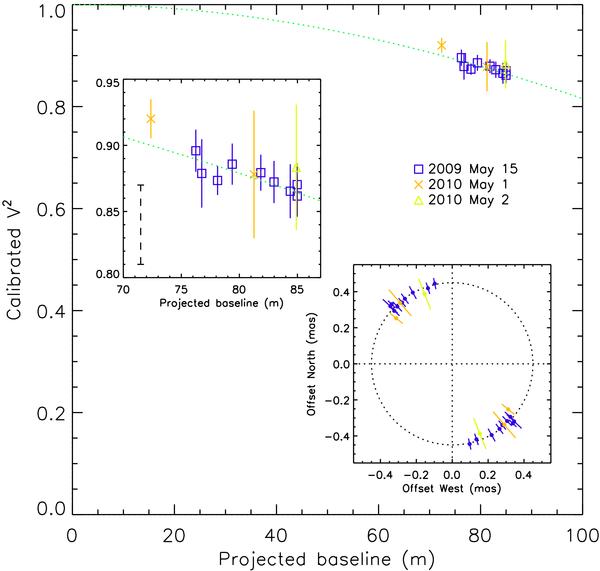
Calibrated V2 for NGC 4151 as a function of projected baselines. Squares show our previous data taken in May 2009 (Paper I), while crosses and triangle are the new data taken on 2010 May 1 and 2, respectively, all being enlarged in the left inset. The absolute V2 calibration is said to have a possible systematic error up to 0.03 (see Sect. 3.2), which is shown as a dashed vertical bar in this inset. The dotted line in each panel shows the best-fit visibility curve of a thin-ring model with a radius of 0.45 mas for our previous May 2009 data. In the right inset, ring radii corresponding to each data point are plotted along the PA of each projected baseline. Note that the correction for the accretion disk and host galaxy contributions is not incorporated in this figure, and does not significantly change the ring radius (see Table 2).
Current usage metrics show cumulative count of Article Views (full-text article views including HTML views, PDF and ePub downloads, according to the available data) and Abstracts Views on Vision4Press platform.
Data correspond to usage on the plateform after 2015. The current usage metrics is available 48-96 hours after online publication and is updated daily on week days.
Initial download of the metrics may take a while.