| Issue |
A&A
Volume 527, March 2011
|
|
|---|---|---|
| Article Number | L9 | |
| Number of page(s) | 4 | |
| Section | Letters | |
| DOI | https://doi.org/10.1051/0004-6361/201015975 | |
| Published online | 08 February 2011 | |
Letters to the Editor
Strong radial segregation between sub-populations of evolutionary homogeneous stars in the Galactic globular cluster NGC 6752⋆
1
Instituto de Astronomía, Universidad Católica del Norte,
Avenida Angamos 0610,
Antofagasta,
Chile
e-mail: This email address is being protected from spambots. You need JavaScript enabled to view it.
2
Sternberg Astronomical Institute, University Avenue 13,
119992
Moscow,
Russia
3
Isaac Newton Institute of Chile, Ministerio de Educación de Chile, Casilla 8-9, Correo
9, Santiago,
Chile
e-mail: This email address is being protected from spambots. You need JavaScript enabled to view it.
, This email address is being protected from spambots. You need JavaScript enabled to view it.
4
ESO – European Southern Observatory, Alonso de Cordova 3107, Vitacura, Santiago, Chile
e-mail: This email address is being protected from spambots. You need JavaScript enabled to view it.
Received: 22 October 2010
Accepted: 17 January 2011
Abstract
Aims. We investigate the new and still poorly studied matter of so-called multiple stellar populations (MSPs) in Galactic globular clusters (GGCs). Studying MSPs and their accumulated data can shed more light on the formation and evolution of GGCs and other closely related fundamental problems. We focus on the strong relation between the radial distribution of evolutionary homogeneous stars and their U-based photometric characteristics in the nearby GGC NGC 6752 and compare this with a similar relation we found in NGC 3201 and NGC 1261.
Methods. We use our new multi-color photometry in a fairly wide field of NGC 6752, with particular emphasis on the U band and our recent and already published photometry made in NGC 3201 and NGC 1261.
Results. We found and report here for the first time a strong difference in the radial distribution between the sub-populations of red giant branch (RGB) stars that are bluer and redder in color (U − B), as well as between sub-giant branch (SGB) stars brighter and fainter in the U-magnitude in NGC 6752. Moreover, the fainter SGB and redder RGB stars are similarly much more centrally concentrated than their respective brighter and bluer counterparts. Virtually the same applies to NGC 3201. We find evidence in NGC 6752 as in NGC 3201 that a dramatic change in the proportion of the two sub-populations of SGB and RGB stars occurs at a radial distance close to the half-mass radius, Rh, of the cluster. These results are the first detections of the radial trend of the particular photometric properties of stellar populations in GGCs. They imply a radial dependence of the main characteristics of the stellar populations in these GGCs, primarily of the abundance, and (indirectly) presumably of the kinematics.
Key words: globular clusters: general / globular clusters: individual: MGC 6752 / globular clusters: individual: NGC 3201 / globular clusters: individual: NGC 1261
Based on observations with the 1.3 m Warsaw telescope at Las Campanas Observatory.
© ESO, 2011
1. Introduction
The southern Galactic globular cluster (GGC) NGC 6752 is one of the nearest and most frequently studied GGCs. However, we here deal with a fairly new aspect, which is related to photometric manifestations of the so-called multiple stellar populations (MSPs) in GGCs. Beside ω Cen they were initially revealed thanks to accurate Hubble space telescope photometry in most massive GGCs, such as NGC 2808 (Piotto et al. 2007) NGC 1851 (Milone et al. 2008) among others, caused by the splitting of the sub-giant branch (SGB) or/and of the main sequence (MS). The splitting of the red giant branch (RGB) in most massive GGCs was also shown by Lee et al. (2009) using ground-based observations. Soon after that, evidence of MSPs have been revealed in lower mass GGCs, similar to NGC 6752.
A recent paper by Milone et al. (2010) is the first publication devoted to MSPs in NGC 6752. They argue that the broadening of the MS, visible in the color-magnitude diagram (CMD) obtained from the high-precision Hubble space telescope photometry of the cluster cannot be attributed to photometric errors or to binary stars. Also, a spread in the (U − B) color of RGB stars is found to correlate with variations in Na and O abundances.
We find and report on direct evidence for the inhomogeneity of the clusters’ stellar population caused by the obvious manifestation, found for the first time in NGC 6752, of strong radial segregation between photometrically differing sub-populations of evolutionary homogeneous cluster stars. We also compare the obtained results with our recent similar findings in NGC 3201 (Kravtsov et al. 2010a) and NGC 1261 (Kravtsov et al. 2010b).
2. The observations and photometric data
In the present study of NGC 6752, we are relying on our new multi-color UBVI photometry (to be published in a forthcoming paper of Kravtsov et al.) of 18 508 stars (mainly in the V and B) in a 14′ × 14′ field approximately centered on the cluster, which reaches a few magnitudes below the turnoff point in all passbands. The observations were gathered on three consecutive nights in October 1999, with the 1.3 m Warsaw telescope at Las Campanas Observatory. A 2048 × 2048 CCD camera was used, with an angular scale of  . We took a total of 44 frames. The FWHM was estimated to be less than
  in 21 frames and above
  in 8 frames. The air mass varied between 1.204 and 1.514. Despite this modest resolution, MS stars were measured at a radial distance of up to ~
 from the cluster center, thanks to the proximity of NGC 6752.
NGC 3201 and NGC 1261 were observed with the same facility. Concerning NGC 3201, in the analysis and plot presented here we used photometric data corrected for differential reddening and decontaminated of field stars as described in Kravtsov et al. (2009) and in Kravtsov et al. (2010a). All details concerning our photometry in NGC 1261 can be found in Kravtsov et al. (2010b).
3. The radial variation of the U level of the SGB
Like in NGC 1261 and NGC 3201, we find the SGB is systematically brighter in the outer part of NGC 6752.
To study the radial variation of the mean level of the SGB in the U-magnitude, we first isolated a total sample of stars most probably belonging to the SGB. To this aim, we used the U-based CMD with (B − I) color-index, which provides a large separation between the turnoff (TO) point and the lower RGB. Stars were selected in the color range Δ(B − I) = 0.225 (1.275 < (B − I) < 1.500) and magnitude range ΔU = 0.3 mag between the upper and lower borders of the branch, traced in the CMD and approximated by two envelope curves. These curves were drawn by fitting the corresponding SGB envelopes, with second degree polynomials differing only in their constant term: U = 3.854(B − I)2 – 10.852(B − I) + 24.631 and U = 3.854(B − I)2 – 10.852(B − I) + 24.931 for the upper and lower borders, respectively. The total number of the selected stars is 451. We then divided the obtained sample of the SGB stars by three sub-samples: (1) 189 brighter SGB stars, in a magnitude range ΔU = 0.12 mag; (2) 143 fainter SGB stars confined in the same magnitude range; (3) an intermediate sub-sample of 119 SGB stars falling in the magnitude range ΔU = 0.06 in between the two extreme ranges. The selection boxes are marked in the upper panel of Fig. 1.
 |
Fig. 1 Upper panel: the sub-samples of brighter (blue dots) and fainter (red dots) SGB stars isolated in the U − (B − I) CMD. Their CRDs are shown by the blue and red lines, respectively, in the lower panel; these are compared with the CRDs for the sub-samples of brighter (dotted line) and fainter SGB stars in the B magnitude. 100 pixels correspond to |

The blue and red lines in the lower panel of Fig. 1 are the cumulative radial distributions (CRDs) of the isolated sub-samples of brighter and fainter SGB stars, respectively, shown by the same colors in the upper panel. The presented CRDs show that the fainter sub-giants in the U band are much more centrally concentrated than the brighter counterparts. These CRDs are essentially dissimilar, as is supported by a Kolmogorov-Smirnov (KS) test: they are different at a confidence level of more than 99.9%. This notable effect is valid for the U band only. Indeed, in the lower panel of Fig. 1 we plotted for comparison the CRDs of the sub-samples of brighter (dotted line) and fainter (continuous line) SGB stars (160 and 143 ones, respectively) in the B magnitude, which were isolated in the same color range as in the U − (B − I) CMD. Brighter and fainter selection boxes are of equal magnitude ranges, ΔB = 0.10 mag, separated by a magnitude range of ΔB = 0.05 mag. The upper border of the SGB was accepted at B = 18.23−0.79(B − I). The branch is thiner in the B than in the U band. The difference between these distributions is statistically insignificant, based on a KS test, because they are different at a confidence level of 75.5%. This agrees well with a similar comparison made for SGB stars of NGC 3201 in the U and V magnitudes (Kravtsov et al. 2010a). Therefore, the effect we deal with and found for the first time in the three GGCs (NGC 1261, NGC 3201, and NGC 6752) is detectable only in the U band, but it is absent or (much) less significant in other photometric bands (B, V, I).
The compared CRDs in the lower panel of Fig. 1 imply that the strong radial segregation of SGB stars in the U magnitude can hardly be owing to spurious systematic effects caused by a crowding effect, because this would result in the same spurious effect in all magnitudes, with opposite dependence. Indeed, systematically artificially “brighter” SGB stars (blended with fainter MS stars) are expected to concentrate toward the centers of the clusters, but not in their outskirts.
4. The RGB and its color-radial distance diagram
The essential inhomogeneity of SGB stars in NGC 6752 perfectly agrees with that of RGB stars in terms of a similar difference in the radial distributions in the cluster of photometrically distinct sub-populations of red giants.
For our analysis of the RGB of NGC 6752, we selected a sample of the most probable RGB stars using the advantage of a multi-color photometry and proceeded like this. Both in the V − (V − I) and V − (B − V) CMDs we fitted the mean locus of the RGB with polynomials applying corresponding commands in the MIDAS system. We then linearized the RGB by subtracting for each star the color of the mean locus at its luminosity level from the star’s color-index. We left only those stars that satisfied our selection criterion: their deviations δ(B − V) and δ(V − I) from the mean locus in both colors simultaneously did not exceed ± 0.05 mag over the brighter luminosity range of the RGB (V < 13.5) and ± 0.06 over the fainter range. These conditional boundaries of the RGB in the color-index separate the bulk of its stars from the majority of stars belonging to the asymptotic giant branch (AGB) and are comparable with the mean errors in the colors along the RGB. In this way we not only rejected the most probable AGB stars and stars showing a considerable deviation from the RGB fiducial line because of photometric error, but also minimized the contamination of the RGB by possible field stars that can appear among the RGB ones in CMD with a given color-index, but are displaced from the sequence on CMDs with other color-indices. This selection procedure yielded a sample of 931 stars.
Based on this sample we first isolated RGB stars located at different mean radial distances from the center of NGC 6752, namely in its central ( ) and outer (
 ) parts. We plotted these stars in the U − (U − B) CMD with red and blue filled circles, respectively. The diagram displayed in Fig. 2 clearly and unambiguously shows systematically different location in the (U − B) color of RGB stars situated at different radial distances from the cluster center. Evidently RGB stars from the inner region (red circles) are systematically displaced to the redder (U − B) color compared to their counterparts from the cluster outskirts. The difference in the color (U − B) between the two groups of RGB stars was noted by Marino et al. (2008) in GGC M4. From photometry and spectroscopy of a sample of 105 stars in the cluster they showed that the CN-weak red giants with a lower content of Na are on average systematically bluer, by Δ(U − B) = 0.17 in the U − (U − B) CMD, than CN-strong giants with a higher content of Na. Regarding NGC 6752, the mean difference in the (U − B) between reddest and bluest sub-populations of RGB stars can be estimated using so-called color-position diagram (CPD) discussed below. It is on the order of Δ(U − B) ~ 0.20, which is approximately a factor of 1.5 higher than the difference estimated in NGC 3201.
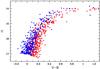 |
Fig. 2 Comparison of the location in the U − (U − B) CMD of RGB stars from the inner (red dots, |

We find CPD is a useful tool to examine in more detail the dependence, for example, of the (U − B) color of RGB stars on their radial distance in a cluster. This diagram was originally applied in our study of the stellar population in the LMC populous star cluster NGC 1978 (Alcaíno et al. 1999) and recently for analysis of inhomogeneous stellar population in NGC 3201 (Kravtsov et al. 2010a).
To obtain the CPD of the RGB, we first additionally edited and slightly cleaned the selected sample of the most probable RGB stars. Because the brightest part of the RGB, with V < 12.5, is quasi-horizontal in U − (U − B) CMD, we rejected these stars. Then we proceeded in the same way as described above to linearize the RGB in the U − (U − B) plane and to reject less than two dozen stars with the largest deviations, | δ(U − B) | > ± 0.20, from the mean locus of the RGB. This number is so small compared with the sample size that this is more a “cosmetic” cleaning with merely esthetic impact. The linearized RGB is shown in the U − δ(U − B) plane in the upper panel of Fig. 3. With the purpose explained below, the linearized RGB was arbitrarily divided by two magnitude ranges (at the level marked by the dashed line) with the following samples of stars: 255 brighter stars with U < 15.7, and 612 fainter stars with U > 15.7.
 |
Fig. 3 Trend of the (U − B) color of RGB stars with their radial distance from the center of NGC 6752. Upper panel: the linearized RGB; its brightest stars (V < 12.5) were rejected. For demonstration purposes, the RGB was arbitrarily divided into two magnitude intervals at the level (U = 15.7) marked by dashed line, where stars are denoted by filled circles of different color. The lower panel shows the color-radial distance diagram of the same RGB stars; 100 pixels correspond to |
The obtained CPD is shown in the lower panel of Fig. 3. It confirms that the (U − B) color does get bluer, i.e. the δ(U − B) becomes more negative with increasing radial distance from the cluster center and that sub-samples of brighter and fainter RGB stars follow the same trend. However, the CPD is not only another method to represent the demonstrated radial photometric inhomogeneity of RGB stars in NGC 6752, but also a plot showing useful details of this inhomogeneity. Indeed, the CPD assumes the trend apparently reveals itself beginning at R ≈ 400 pixels ( ) and there is no obvious trend within this radial distance where the bulk of stars have positive deviations δ(U − B). Interestingly enough, this radial distance is comparable with the cluster half-mass radius,
  (Harris 1996). We noted a very similar behavior of the CPD of NGC 3201 (Kravtsov et al. 2010a). We are inclined to ascribe it to a real effect rather than to some spurious systematic one for two reasons. If it were some systematic photometric effect, for example caused by crowding, brighter stars are normally less affected by it than fainter ones. The behavior of the CPD traced by the brighter RGB stars (black filled circles in Fig. 3) should therefore be more reliable. The second reason deals with the peculiarity of the radial distribution of both RGB and SGB stars, which is discussed below.
We compared the distribution of photometrically distinct sub-populations of SGB and RGB stars in the observed field of NGC 6752. With this purpose we selected the sub-populations of “blue” and “red” RGB stars with δ(U − B) < −0.05 and δ(U − B) > 0.05, respectively. This separation (conditional to a certain extent, of course) minimizes the mutual contamination between the two sub-populations by stars with large photometric errors. Two sub-populations of the SGB are the described above samples of brighter and fainter stars in the U magnitude. We show the resulting four sub-samples of stars by different colors in respective CMDs and in the cluster field in Fig. 4. Blue and red filled circles are the selected “blue” and “red” RGB stars, while green and magenta filled circles are brighter and fainter SGB stars in the U band, respectively. This figure clearly shows a strong difference in the radial distribution between the sub-populations of the “blue” and “red” RGB stars. Moreover, the same very similar difference between the radial distribution of SGB stars brighter and fainter in the U-magnitude is obvious in NGC 6752 as well. On the other hand, the faint SGB and red RGB stars are similarly much more centrally concentrated than their respective bright and blue counterparts. Interestingly enough NGC 3201 exhibits virtually the same very similar behavior of the radial distribution of photometrically distinct sub-populations of SGB and RGB stars. The distribution of the latter stars is shown in Fig. 5.
Figure 4 shows that the distribution of stars in the X, Y planes, especially of the “bluer” RGB and “brighter” SGB stars distributed across a larger area, is somewhat spotted, and the centers of the distributions of sub-populations in the upper and lower plots are somewhat different. These effects are probably caused by a combination of different factors. To name a few major factors: (i) statistical fluctuation caused by the relatively small “surface density” of the “bluer” RGB and “brighter” SGB stars and (ii) larger confusion (poorer distinguishing) between the sub-populations of the same evolutionary sequence toward the center of the cluster, caused by increased systematic and random photometric errors.
 |
Fig. 4 Comparison of the location in the observed field of NGC 6752 of (1) two sub-populations of RGB stars, with δ(U − B) > 0.05 (red filled circles) and δ(U − B) < − 0.05 (blue filled circles), and (2) two sub-populations of SGB stars, fainter (magenta filled circles) and brighter (green filled circles) in the U magnitude. The same stars are shown with the same colors in the U − (U − B) and U − (B − I) CMDs of the RGB and SGB, respectively. The X and Y coordinates increase to the east and north. |
 |
Fig. 5 Radial distributions of RGB stars with a different deviation δ(U − B) from the ridgeline of the RGB in the U − (U − B) diagram of NGC 3201. The continuous and long-dashed lines are the histograms of RGB stars with δ(U − B) > 0.05 and δ(U − B) < − 0.05, respectively. 100 pixels approximately correspond to |
5. Conclusions
Based on a new multi-color photometry in a fairly wide field of NGC 6752, we found and report the following direct evidence of the inhomogeneity (multiplicity) of the cluster’s stellar population.
There is an essential radial segregation of SGB stars in the cluster, depending on their brightness in the U band: the fainter
sub-population of sub-giants is obviously centrally concentrated, and the bulk of these are confined within the cluster region with the half-mass radius, Rh, while their brighter counterparts show a flatter radial distribution within the observed field.
The sub-populations of photometrically distinct RGB stars also exhibit essential radial segregation in NGC 6752: RGB stars redder in the color (U − B), like the sub-population of the fainter SGB stars, are centrally concentrated mostly within the region with radius R ~ Rh, as opposed to the sub-populations of both RGB stars bluer in the (U − B) color and SGB stars brighter in the U band. We note virtually the same radial segregation between photometrically distinct sub-populations both of RGB and SGB stars in NGC 3201. In NGC 1261 (Kravtsov et al. 2010b), we also found similar trends, but we are not able to adequately judge what exactly happens in its central part.
The revealed and demonstrated strong radial segregation between the sub-populations in NGC 6752 and NGC 3201 is closely related with the difference of their photometric characteristic either in the U magnitude (SGB stars) or in the (U − B) color (RGB stars), which are known to be sensitive to metallicity. Therefore, the obtained results not only provide evidence for the radial segregation itself between the sub-populations, but also imply (1) the radial dependence of the abundance of those elements, which are mainly responsible for this photometric difference between stars in the clusters, and (2) presumably different kinematics between the sub-populations. In this context, it would be important to study whether there is a radial trend (and what it is exactly) of the elemental abundance in NGC 6752 and other GGCs.
Acknowledgments
We thank the anonymous referee for useful comments that improved the manuscript.
References
- Alcaíno, G., Liller, W., Alvarado, F., et al. 1999, A&AS, 135, 103 [NASA ADS] [CrossRef] [EDP Sciences] [Google Scholar]
- Harris, W. E. 1996, AJ, 112, 1487 [NASA ADS] [CrossRef] [Google Scholar]
- Kravtsov, V., Alcaíno, G., Marconi, G., & Alvarado, F. 2009, A&A, 497, 371 [NASA ADS] [CrossRef] [EDP Sciences] [Google Scholar]
- Kravtsov, V., Alcaíno, G., Marconi, G., & Alvarado, F. 2010a, A&A, 512, L6 [NASA ADS] [CrossRef] [EDP Sciences] [Google Scholar]
- Kravtsov, V., Alcaíno, G., Marconi, G., & Alvarado, F. 2010b, A&A, 516, A23 [NASA ADS] [CrossRef] [EDP Sciences] [Google Scholar]
- Lee, J.-W., Kang, Y.-W., Lee, J., & Lee, Y.-W. 2009, Nature, 462, 480 [NASA ADS] [CrossRef] [PubMed] [Google Scholar]
- Marino, A. F., Villanova, S., Piotto, G. et al. 2008, A&A, 490, 625 [NASA ADS] [CrossRef] [EDP Sciences] [Google Scholar]
- Milone, A. P., Bedin, L. R., Piotto, G., et al. 2008, ApJ, 673, 241 [NASA ADS] [CrossRef] [Google Scholar]
- Milone, A. P., Piotto, G., King, I. R., et al. 2010, ApJ, 709, 1183 [NASA ADS] [CrossRef] [Google Scholar]
- Piotto, G., Bedin, L. R., Anderson, J., et al. 2007, ApJ, 661, L53 [NASA ADS] [CrossRef] [Google Scholar]
All Figures
|
Fig. 1 Upper panel: the sub-samples of brighter (blue dots) and fainter (red dots) SGB stars isolated in the U − (B − I) CMD. Their CRDs are shown by the blue and red lines, respectively, in the lower panel; these are compared with the CRDs for the sub-samples of brighter (dotted line) and fainter SGB stars in the B magnitude. 100 pixels correspond to |
| In the text | |
|
Fig. 2 Comparison of the location in the U − (U − B) CMD of RGB stars from the inner (red dots, |
| In the text | |
|
Fig. 3 Trend of the (U − B) color of RGB stars with their radial distance from the center of NGC 6752. Upper panel: the linearized RGB; its brightest stars (V < 12.5) were rejected. For demonstration purposes, the RGB was arbitrarily divided into two magnitude intervals at the level (U = 15.7) marked by dashed line, where stars are denoted by filled circles of different color. The lower panel shows the color-radial distance diagram of the same RGB stars; 100 pixels correspond to |
| In the text | |
|
Fig. 4 Comparison of the location in the observed field of NGC 6752 of (1) two sub-populations of RGB stars, with δ(U − B) > 0.05 (red filled circles) and δ(U − B) < − 0.05 (blue filled circles), and (2) two sub-populations of SGB stars, fainter (magenta filled circles) and brighter (green filled circles) in the U magnitude. The same stars are shown with the same colors in the U − (U − B) and U − (B − I) CMDs of the RGB and SGB, respectively. The X and Y coordinates increase to the east and north. |
| In the text | |
|
Fig. 5 Radial distributions of RGB stars with a different deviation δ(U − B) from the ridgeline of the RGB in the U − (U − B) diagram of NGC 3201. The continuous and long-dashed lines are the histograms of RGB stars with δ(U − B) > 0.05 and δ(U − B) < − 0.05, respectively. 100 pixels approximately correspond to |
| In the text | |
Current usage metrics show cumulative count of Article Views (full-text article views including HTML views, PDF and ePub downloads, according to the available data) and Abstracts Views on Vision4Press platform.
Data correspond to usage on the plateform after 2015. The current usage metrics is available 48-96 hours after online publication and is updated daily on week days.
Initial download of the metrics may take a while.