| Issue |
A&A
Volume 527, March 2011
|
|
|---|---|---|
| Article Number | L5 | |
| Number of page(s) | 4 | |
| Section | Letters | |
| DOI | https://doi.org/10.1051/0004-6361/201015934 | |
| Published online | 02 February 2011 | |
Letter to the Editor
Simulation of dark lanes in post-flare supra-arcades
III. A 2D simulation
1
Facultad de Ingeniería, Universidad Nacional de Río
Cuarto, Argentina
2
Instituto de Astronomía Teórica y Experimental,
Córdoba,
Argentina
e-mail: This email address is being protected from spambots. You need JavaScript enabled to view it.
3 Facultad de Ciencias Exactas, Físicas y Naturales,
Universidad Nacional de Córdoba, Argentina
4 Consejo Nacional de Investigaciones Científicas y Técnicas,
Argentina
Received: 14 October 2010
Accepted: 18 January 2011
Abstract
Context. Observational dark sinuous inflows moving sunwards, along a fan of rays were previously numerically reproduced with two simulations of 1.5D for the first time. We showed that the dark tracks can be explained as hot plasma voids generated upstream of a slow magnetoacoustic shock wave that is produced by a localized deposition of energy.
Aims. We aim to confirm our “dark lane” interpretation and to identify specific 2D contributions to the description of the phenomenon.
Methods. To solve the ideal and non-stationary MHD equations we used a 2D Riemann solver Eulerian code specially designed to capture supersonic flow discontinuities.
Results. The numerical 2D results agree with the observational behaviour, but they show a slight shift in the characteristic parameter with respect to those found previously.
Conclusions. We qualitatively confirm the behaviour found in previous papers. For a given numerical domain the period of the kink-like structure is a function of the magnetic field intensity: larger periods are associated with lower magnetic field intensities. Contrary to the 1.5D result – where the sunwards dynamic is independent of the magnetic field intensity owing to its exclusive waveguide role – in the 2D simulation the sunwards speed is higher for higher values of the magnetic field. This can be interpreted as the capability of the low coronal plasma to collimate the deposition of energy into the magnetic field direction. The moving features that consist on low-density and high-temperature plasma cavities have higher inside values of the structuring parameter β than the neighbouring media. Thus, the voids seem to be the emergence structures of a whole nonlinear interacting plasma context of shocks and waves instead of voided plasma loops that are magnetically structured.
Key words: Sun: corona / magnetohydrodynamics / shock waves
© ESO, 2011
1. Introduction
Dark sinuous lanes moving towards the Sun along a fan of rays above post-flare loops towards a supra-arcade have been extensively studied (Innes et al. 2003a,b; McKenzie & Savage 2009). The down-moving structures observed at [40 − 60] Mm height above the top of the arcades, with a decelerating speed in the range ~[50−500] km s-1 were interpreted as sunwards orientated voided flows generated by reconnection processes that were developed by a current sheet above the flare arcade. Another configuration that is consistent with the observations is a magnetic flux tube, filled with flux and very little plasma, shrinking into the post-eruption arcade (McKenzie & Hudson 1999; McKenzie 2000). Recently Linton et al. (2009) proposed another scenario where the dynamic is triggered by a localized reconnection event that produces up and down flowing reconnected flux tubes, which decelerate because of underlying magnetic arcade loops. Verwichte et al. (2005, hereafter VNC) analysed oscillations transverse to the magnetic field that are associated with sunwards orientated dark lanes in a post-flare supra-arcade. They found that the initial speeds and the displacement amplitudes, which are of a kink-like type in observational dark lanes, decrease as they propagate downwardly, while the period remains constant with height.
In Costa et al. (2009) and Schulz et al. (2010) (hereafter Paper 1 and Paper 2, respectively) we presented a new scenario by the integration of two 1.5D MHD ideal equations, which accounts of the observational dark voids described in VNC. We simulated the effects of an initial impulsive and localized deposition of energy – which is supposed to be associated with the above reconnection processes – in a plasma structured by sunwards orientated magnetic field lines. The impulsive phase was modelled by a pressure perturbation that initiates two main processes, a fundamentally hydrodynamic shock pattern directed sunwards and a perpendicular magnetic shock one, i.e., transverse to the magnetic field. The two patterns were supposed to be independent processes, but they are linked by their common origin and the background magnetic and density conditions. The independence of the two dynamics was justified by the far more effective conductive energy transport along field lines compared with across them.
We showed that the dark tracks are consistent with plasma voids generated by the bouncing and interfering of shocks and expansion waves upstream of the initial localized deposition of energy, which is responsible for the two dynamics. The composition of both a resulting sunwards directed hydrodynamic shock pattern and a perpendicular magnetic shock one produces an overall β > 1 transversely shaking void that moves towards the surface of the Sun, which resembles the kink-like mode described in VNC.
From the transverse simulation we found that in accordance with the shock-wave theory of uniform media (Kirk et al. 1994), there is a critical value of the magnetic field beyond which the behaviour of the magnetic shock pattern changes, the magnetic compression is limited, and the phenomenon is progressively saturated. We also found that the period of the kink-like structure is a function of the magnetic field intensity, while the amplitude is a function of the triggering pressure pulse. Thus, the period’s constancy with height found in VNC can be associated with the almost constancy with height of the background magnetic field in the region. In accordance with our interpretation that in the sunwards direction the magnetic field plays the role of being a wave-guide, we found that the pressure pulse determines a hydrodynamic shock that moves towards the surface of the Sun with slow-wave magnetoacoustic speeds and the dynamic is independent of the magnetic field intensity.
In this paper we investigate the goodness of the 1D model and discuss the limitations and new characteristics of the phenomenon associated with the 2D structure.
2. Numerical code and initial conditions
We integrated the MHD equations with the two-dimensional version of the “Mezcal” code, an Eulerian Godunov MHD code (De Colle & Raga 2005, 2006; De Colle et al. 2008). The MHD Riemann solver uses a standard second-order Runge-Kutta method for the time integration and a spatially second-order reconstruction of the primitive variables at the interfaces (except in shocks). The constrained transport method (e.g., Tóth 2000) is used to conserve ∇·B = 0 to machine accuracy. The code has been extensively tested against standard problems (De Colle 2005).
All calculations were performed with a numerical grid of (x,y) = (1600,620) grid-points corresponding to a physical size of (40, 9) Mm, chosen in accordance with the observations of VNC. The coordinate x represents the sunwards direction and the y coordinate the transverse to the magnetic field one, as seen by the line of sight. We assumed a constant radial initial magnetic field structure, a typical background temperature of T = 3.0 × 10⁶ K and a numerical density value of ρ = 0.46 × 109 cm-3. A spherical pulse P2/P1 (P2 is the triggering pressure pulse and P1 is the background gas pressure of the corona) of a radius 0.6 Mm was localized in the position (1520,434) equivalent to (38,6.3) Mm.
Several simulation were carried out, varying the radial (normal to the Sun’s surface) magnetic field, B, and the localized deposition of energy, modelled as the triggering pressure pulse. As in Paper 1 and Paper 2, the boundary conditions were fixed, allowing rebounds in the lateral transverse directions and also in the upper radial direction, resembling the action of the reconnection site. We assumed that the perturbations are absorbed in the sunwards direction. The characteristic parameters were chosen in accordance with typical observed dark lane structures, as in VNC and McKenzie & Hudson (1999).
3. Results and discussion
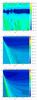 |
Fig. 1 Density patterns (g cm-3): a) transverse kink-like oscillation of the dark lane as a function of time for 4 G. b) and c) sunwards motion as a function of time for 4 G and 20 G, respectively. P2/P1 = 100 G. |
Figures 1a, b show the density pattern in the central transverse direction and in the central longitudinal direction as a function of time for P2/P1 = 100 and B = 4 G. The figures are qualitatively similar to the 1D simulations (see Paper 1 and Paper 2). The transverse kink-like structure is discontinued at a time step ~80 s, apparently a strong shock front has swept material and locally erased the vacuum trace. These features, which recall observational constrictions (see e.g., Innes et al. 2003a,b) were found in several cases at different positions and times, they are the result of nonlinear interactions that are difficult to predict. For a further comparison we varied the background magnetic field. Table 1 shows the numerical periods (τ), amplitudes (A), the distances cleared by the moving perturbations (Lv), and the initial speeds (V0) obtained for 2 G, 4 G, 8 G, and 20 G and for P2/P1 = 100. These results are consistent with the characteristic observational values given in literature, e.g., VNC, McKenzie & Hudson (1999). However, to match the periods of decades of seconds and amplitudes of hundreds of kilometers we required pressure pulses almost one order of magnitude higher than for 1.5D. As before, we found that lower values of the magnetic field are associated with larger periods (see the second column of Table 1). Moreover, the phenomenon is progressively saturated and resembles the compressional limits (in density and magnetic field intensity) of the HD and transverse MHD shock wave theory in a uniform medium (Kirk et al. 1994), i.e., the augmentation of the magnetic field from 4 G to 6 G implies a decrease of 55 s in the period, while the change of magnetic field from 8 G to 20 G implies a decrease of only 10 s in the period. There is no visible relation between the magnetic field and the amplitude.
Figure 1c represents the void density for the longitudinal dynamic of the 20 G magnetic field. Contrary to the sunwards behaviour found in the 1.5D simulations, when comparing Fig. 1c with the 4 G case of Fig. 1b, the void associated with larger magnetic field intensities travels a higher distance in the sunwards direction (see Table 1, fourth column). In Paper 2, the hypothesis of independence between the two 1D simulations was justified by the anisotropy imposed by the magnetic field, thus its role was solely to wave-guide the longitudinal dynamic. In the 2D simulation the deposition of energy is distributed radially, from the location of the initial perturbation to all directions of the (x,y) plane. However, the freezing-in of the plasma to the magnetic field induces the collimation of part of the energy towards the longitudinal direction. The more intense magnetic fields are the more efficient in line-tying the energy, thus giving impulse to the final resulting sunwards orientated motion. Hence, the larger the magnetic field, the more accurate the 1.5D description will be.
Numerical 2D parameters.
Figures 2a–d show the “dark lane” density structure, the temperature, the parameter β, and the total pressure displayed in the whole numerical domain for 4 G and P2/P1 = 100 at t = 200 s. As in Paper 2, the vacuum density is almost one order of magnitude lower than the external medium, in accordance with observational data (see Fig. 3a), while the vacuum temperature is almost one order of magnitude higher than the temperature in the surroundings. When plotting β we see an extended channel (not confined to the vacuum zone) of inner β values lower than the outside ones. This behaviour occurs for the other cases with different magnetic field intensities. Figure 3a shows the ratio of an average inner to an average outer β value for the different cases studied at a fixed height of 35 Mm. This indicates, as in Paper 2, that the inner magnetic pressure is not responsible for preventing the collapse of the vacuum zone. Furthermore, from Fig. 2d it is evident that the features that characterize the vacuum zone have disappeared, which means that the contour of the cavity is, on average, in total pressure equilibrium. This confirms that the void dynamics must be sustained by the interaction of nonlinear waves and shocks acting in times comparable to the observations. For a more detailed description Fig. 3b shows the gas the magnetic pressure, and the total pressure at each point corresponding to the line traced in Fig. 2a. The almost constancy of the total pressure is caused by the gas pressure increase (which can only be accomplished by high temperatures) accompanied by a magnetic pressure decrease throughout the vacuum region.
In Paper 2 we found that the cases studied had β > 1, whereas in the 2D simulations only the cases with magnetic fields lower than 3 G have β > 1. However, as for 1.5D, the behaviour is explained because β is higher inside than outside the voided cavity, i.e., the cavity is a result of dynamic nonlinear interacting waves and shocks that sustain the whole pattern. Note the different shape of the curve in Fig. 3a. The almost constant value of the curve for high values of the magnetic field intensity indicate a uniform behaviour within this range. The steep negative slope of the high inner values of β and the low values of the magnetic field, up to B ~ 3 G, exhibit a dynamic where the anisotropy imposed by the magnetic field is softened and 2D features become more significant. However, magnetic field intensities lower than B ~ 2.5 G have unperturbed β > 1 values, which are unrealistic parameters for the low corona description. We conclude that the two 1D simulations give a good approximate description of the phenomenon.
Four runs with different P2/P1 were carried out to analyse the behaviour of the voids. Table 2 shows the periods τ, the amplitudes A, the distances cleared by the perturbations Lv, and the initial speed for a magnetic field intensity of 8 G as a function of P2/P1. The obtained parameters correspond with typical observed parameter ranges (see Table 1 in VNC). From Table 2 we see that, as in Paper 2, the increase of P2/P1, implies the increase of the initial speed and the distance cleared by the perturbation, whereas the periods and amplitudes show no regular variation.
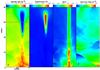 |
Fig. 2 a) Density; b) temperature; c) β parameter; and d) total pressure of the dark lane pattern. For all the cases we used the (x,y) grid defined as in VNC, x the radial direction and y the transverse direction, the magnetic field is 4 G, the time is 200 s, and the triggering pulse is P2/P1 = 100 G. |
4. Conclusions
We performed a 2D numerical simulation to reproduce observed dark sinuous lanes moving sunwards towards supra-arcades. In previous papers we reproduced the observational features of the phenomenon with two 1.5D simulations supposed to be independent because of the far more effective transport along the field lines than across them, and that were triggered by a pressure pulse acting in the transverse and longitudinal directions. The correspondent transverse and longitudinal patterns obtained from the 2D simulation agree with the observations, confirming that the two 1.5D description is suitable for this phenomenon.
The features, travelling decades of Mm, are voided cavities that elongate towards the Sun and decelerate at sound speeds, i.e., at hundreds of km s-1. The 2D results shown in Table 1 reproduce typical periods, amplitudes, and distances travelled by the perturbations as well as their initial speeds. However, the pressure pulse required is almost one order of magnitude higher than in the 1.5D simulations. This seems reasonable because the pulse must trigger the dynamic in all radial directions and not only in the two main ones. As shown in Table 2, the increase of the pressure pulse that triggers the phenomenon augments the initial speed and the distance travelled by the front of the voided cavity. Linton et al. (2009) also reproduce the sunwards orientated motion, though they assume open lateral boundaries and a bottom reconnection site. A main difference with regard to our work is that the reconnection process is intrinsic to their model, because the voids are formed and confined by a current sheet. From their work is unclear if an oscillating behaviour, as described in VNC, is obtained.
 |
Fig. 3 a) β average inner to outer ratio values for different magnetic field intensity cases. b) Gas, magnetic and total pressure values for line marked in Fig. 2a and B = 4 G. P2/P1 = 100 G and τ = 200. |
As in earlier works, we found that lower values of the magnetic field are associated with larger transverse periods. We also find from the behaviour of the period that beyond a critical magnetic field value (between 4 G and 6 G), the phenomenon is progressively saturated with increasing values of the magnetic field. This reminds the compressional limits, in density and magnetic field intensity, of the HD and MHD shock wave theory for uniform media. However, the determination of the critical magnetic field value of this more complex scenario may be conditioned by other parameters not taken into account in this work, such as the distance between the radial boundaries and the radius and shape of the perturbation. The freezing-in of the plasma to the magnetic field induces the collimation of part of the energy in the sunwards direction. Hence, higher magnetic field intensities produce features that travel farther.
Because β is larger inside than outside the voided cavity and its contour is in total pressure equilibrium, we conclude that the internal magnetic pressure cannot be responsible for preventing the collapse of the vacuum zone.
Numerical 2D parameters.
The 2D simulation shows, as in recent papers, that the sunwards moving shaking voids are produced and sustained by two main processes that can be viewed as almost independent phenomena if the magnetic field intensity is sufficiently high: the interaction of nonlinear waves and shocks that rebound in the lateral denser medium, and the interaction of nonlinear waves and shocks that rebound upwards and are absorbed sunwards.
References
- Costa, A., Elaskar, S., Fernández, C., & Martínez, G. 2009, MNRAS, 400, L85 [NASA ADS] [Google Scholar]
- De Colle, F. 2005, Ph.D. Thesis, UNAM [Google Scholar]
- De Colle, F., & Raga, A. C. 2005, MNRAS, 359, 164 [NASA ADS] [CrossRef] [Google Scholar]
- De Colle, F., & Raga, A. C. 2006, A&A, 449, 1061 [NASA ADS] [CrossRef] [EDP Sciences] [Google Scholar]
- De Colle, F., Raga, A. C., & Esquivel, A. 2008, ApJ, 689, 302 [NASA ADS] [CrossRef] [Google Scholar]
- Fernández, C., Costa, A., Elaskar, S., & Shulz, W. 2009, MNRAS, 400, 1821 [NASA ADS] [CrossRef] [Google Scholar]
- Innes, D. E., McKenzie, D., & Wang, T. 2003a, Sol. Phys., 217, 247 [NASA ADS] [CrossRef] [Google Scholar]
- Innes, D. E., McKenzie, D., & Wang, T. 2003b, Sol. Phys., 217, 267 [NASA ADS] [CrossRef] [Google Scholar]
- Kirk, J., Melrose, D., & Priest, E. 1994, Plasma Astrophysics (Berlin: Verlag) [Google Scholar]
- Linton, M. G., DeVore, C. R., & Longcope, D. W. 2009, Earth Planets Space, 61, 1, [Google Scholar]
- McKenzie, D. 2000, Sol. Phys., 195, 381 [NASA ADS] [CrossRef] [Google Scholar]
- McKenzie, D., & Hudson, H. 1999, ApJ, 519, L93 [NASA ADS] [CrossRef] [Google Scholar]
- McKenzie, D., & Savage, S. 2009, ApJ, 697, 1569 [NASA ADS] [CrossRef] [Google Scholar]
- Schulz, W., Costa, A., Elaskar, S., & Cid, G. 2010, MNRAS, 407, L89 [NASA ADS] [Google Scholar]
- Tóth, G. 2000, J. Comput. Phys., 161, 605 [Google Scholar]
- Verwichte, E., Nakariakov, V., & Cooper, F. 2005, A&A, 430, L65 [NASA ADS] [CrossRef] [EDP Sciences] [Google Scholar]
All Tables
All Figures
|
Fig. 1 Density patterns (g cm-3): a) transverse kink-like oscillation of the dark lane as a function of time for 4 G. b) and c) sunwards motion as a function of time for 4 G and 20 G, respectively. P2/P1 = 100 G. |
| In the text | |
|
Fig. 2 a) Density; b) temperature; c) β parameter; and d) total pressure of the dark lane pattern. For all the cases we used the (x,y) grid defined as in VNC, x the radial direction and y the transverse direction, the magnetic field is 4 G, the time is 200 s, and the triggering pulse is P2/P1 = 100 G. |
| In the text | |
|
Fig. 3 a) β average inner to outer ratio values for different magnetic field intensity cases. b) Gas, magnetic and total pressure values for line marked in Fig. 2a and B = 4 G. P2/P1 = 100 G and τ = 200. |
| In the text | |
Current usage metrics show cumulative count of Article Views (full-text article views including HTML views, PDF and ePub downloads, according to the available data) and Abstracts Views on Vision4Press platform.
Data correspond to usage on the plateform after 2015. The current usage metrics is available 48-96 hours after online publication and is updated daily on week days.
Initial download of the metrics may take a while.