Fig. 8
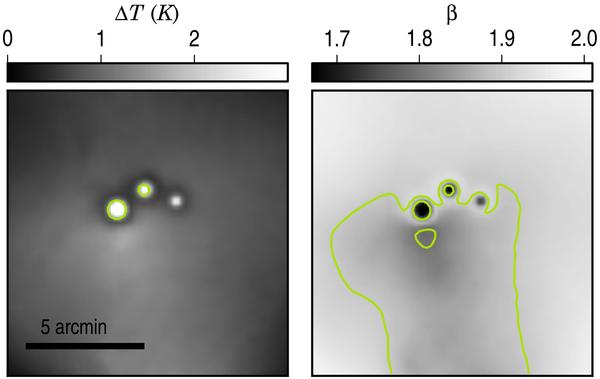
Results of the radiative transfer model of the PCC288 region. The left hand frame shows the difference between the colour temperature derived from synthetic observations and the real mass averaged dust temperature in the model. The right hand frame shows the obtained spectral index β. The contours are drawn at ΔT = 1 K and ΔT = 2 K and at β = 1.8 and β = 1.9.
Current usage metrics show cumulative count of Article Views (full-text article views including HTML views, PDF and ePub downloads, according to the available data) and Abstracts Views on Vision4Press platform.
Data correspond to usage on the plateform after 2015. The current usage metrics is available 48-96 hours after online publication and is updated daily on week days.
Initial download of the metrics may take a while.