Free Access
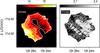
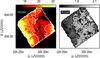
Fig. 4

The colour temperature and dust spectral index maps. The values have been determined by a fit to the observations between 100 μm and 500 μm. The circles indicate the positions for which the spectra are shown in Fig. 5.
This figure is made of several images, please see below:

Current usage metrics show cumulative count of Article Views (full-text article views including HTML views, PDF and ePub downloads, according to the available data) and Abstracts Views on Vision4Press platform.
Data correspond to usage on the plateform after 2015. The current usage metrics is available 48-96 hours after online publication and is updated daily on week days.
Initial download of the metrics may take a while.