Fig. 2
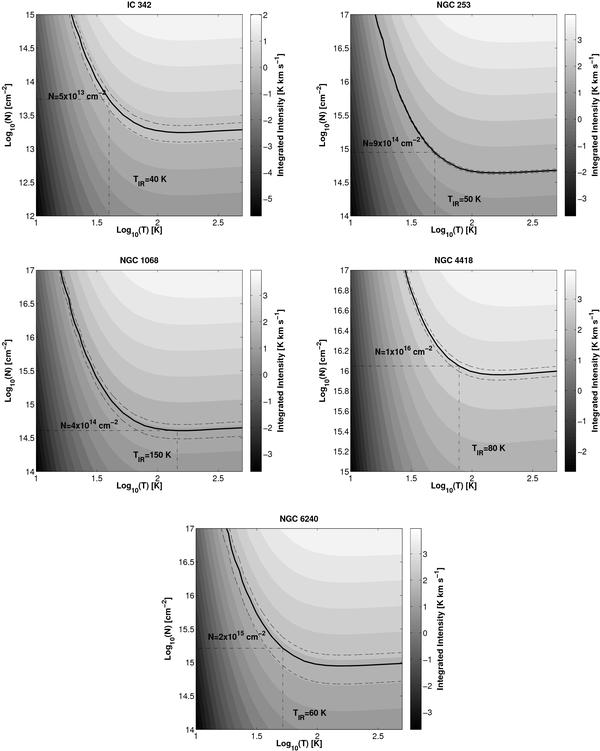
On the x axis we find the temperature of the exciting background radiation and on the y axis the column density of H3O+. For each galaxy, the brightness temperature of the H3O+ transition is shown in a gray scale map. The thick black contour marks the observed value, with one sigma errors marked by dashed lines. Background temperatures estimated by IR observations are also reported and used to derive a column density consistent with the observed brightness temperature. Note that the column density fits include only the para column.
Current usage metrics show cumulative count of Article Views (full-text article views including HTML views, PDF and ePub downloads, according to the available data) and Abstracts Views on Vision4Press platform.
Data correspond to usage on the plateform after 2015. The current usage metrics is available 48-96 hours after online publication and is updated daily on week days.
Initial download of the metrics may take a while.