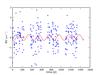
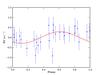
Fig. 11

Detection simulation for a
2.5 M⊕ planet in the habitable zone
(P = 208 days) of a K1 dwarf presenting an activity level
 . Top
panels: detection simulation for the 3N3 strategy. On the
left, we show the raw RVs including the stellar noise (oscillation,
granulation phenomena, and activity) plus the injected planet (red curve). In the
middle, the periodogram of the stellar noise only (red filled
curve) and the stellar noise plus planet (black line) is represented. The horizontal
lines correspond from top to bottom to the 0,1% and the 1% FAP. Finally we show on the
right the raw RVs binned on 1 month and folded in phase with the
period of the planet. Bottom panels: the same but for the 1N1
strategy (strategy presently used for the high-precision HARPS program, one
measurement per night of 15 min on 10 consecutive days per
month).
. Top
panels: detection simulation for the 3N3 strategy. On the
left, we show the raw RVs including the stellar noise (oscillation,
granulation phenomena, and activity) plus the injected planet (red curve). In the
middle, the periodogram of the stellar noise only (red filled
curve) and the stellar noise plus planet (black line) is represented. The horizontal
lines correspond from top to bottom to the 0,1% and the 1% FAP. Finally we show on the
right the raw RVs binned on 1 month and folded in phase with the
period of the planet. Bottom panels: the same but for the 1N1
strategy (strategy presently used for the high-precision HARPS program, one
measurement per night of 15 min on 10 consecutive days per
month).


Current usage metrics show cumulative count of Article Views (full-text article views including HTML views, PDF and ePub downloads, according to the available data) and Abstracts Views on Vision4Press platform.
Data correspond to usage on the plateform after 2015. The current usage metrics is available 48-96 hours after online publication and is updated daily on week days.
Initial download of the metrics may take a while.