Fig. 7
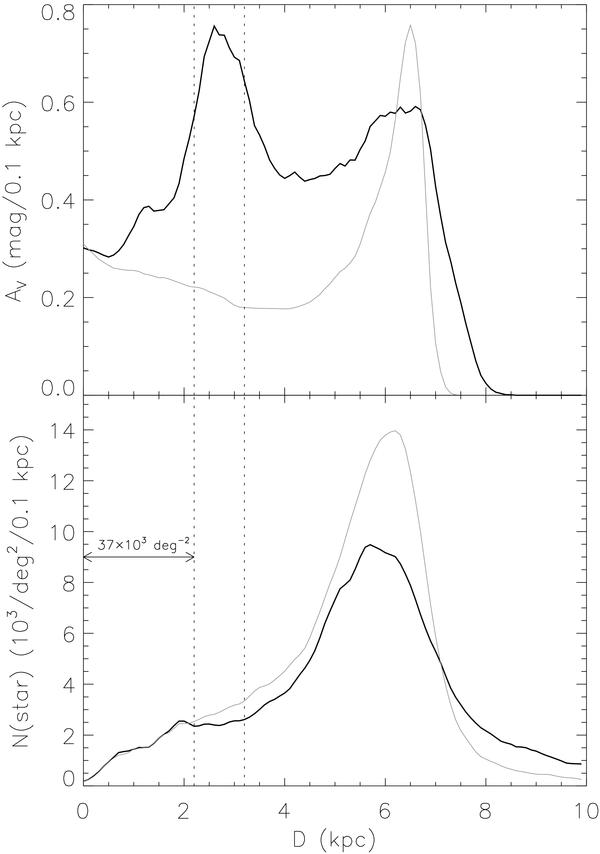
Extinction (top) and star density (bottom) along the Trifid line-of-sight. The black line is the average value for the region where AV > 20 mag in Fig. 6; the gray line is for the region where AV ∈ [0,1] mag. The dashed lines indicate the Trifid location at a distance of 2.7 ± 0.5 kpc.
Current usage metrics show cumulative count of Article Views (full-text article views including HTML views, PDF and ePub downloads, according to the available data) and Abstracts Views on Vision4Press platform.
Data correspond to usage on the plateform after 2015. The current usage metrics is available 48-96 hours after online publication and is updated daily on week days.
Initial download of the metrics may take a while.