Fig. 6
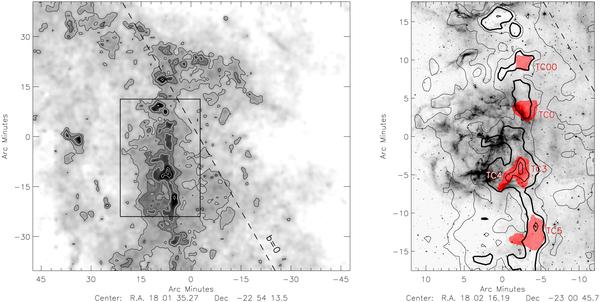
Left: large scale extinction map of the Trifid region. Right: GLIMPSE 8 μm image of the Trifid nebula with iso-extinction contours. In both figures contours correspond to AV = [10,15,20,40,60] mag, the dashed line follows the Galactic plane. The red shaded regions delineate the S1.25 > 10 mJy/11′′ beam Trifid Condensations (TC, Cernicharo et al. 1998) studied in Sect. 4.3 at 1 arcmin resolution.
Current usage metrics show cumulative count of Article Views (full-text article views including HTML views, PDF and ePub downloads, according to the available data) and Abstracts Views on Vision4Press platform.
Data correspond to usage on the plateform after 2015. The current usage metrics is available 48-96 hours after online publication and is updated daily on week days.
Initial download of the metrics may take a while.