Fig. 4
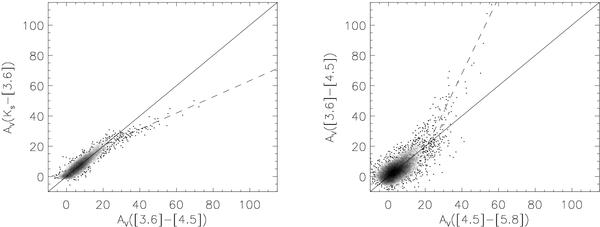
Each plot represents the extinction correlation from two different color excesses. The two parameters A [4.5] /AKs = 0.500 (left plot) and A [5.8] /AKs = 0.398 (right plot) are adjusted to obtain a one-to-one regression line (solid line). The dashed lines trace the deviation at large extinction, the corresponding slopes in these plots are 0.55 ± 0.02 and 2.52 ± 0.09, respectively.
Current usage metrics show cumulative count of Article Views (full-text article views including HTML views, PDF and ePub downloads, according to the available data) and Abstracts Views on Vision4Press platform.
Data correspond to usage on the plateform after 2015. The current usage metrics is available 48-96 hours after online publication and is updated daily on week days.
Initial download of the metrics may take a while.