Fig. 1
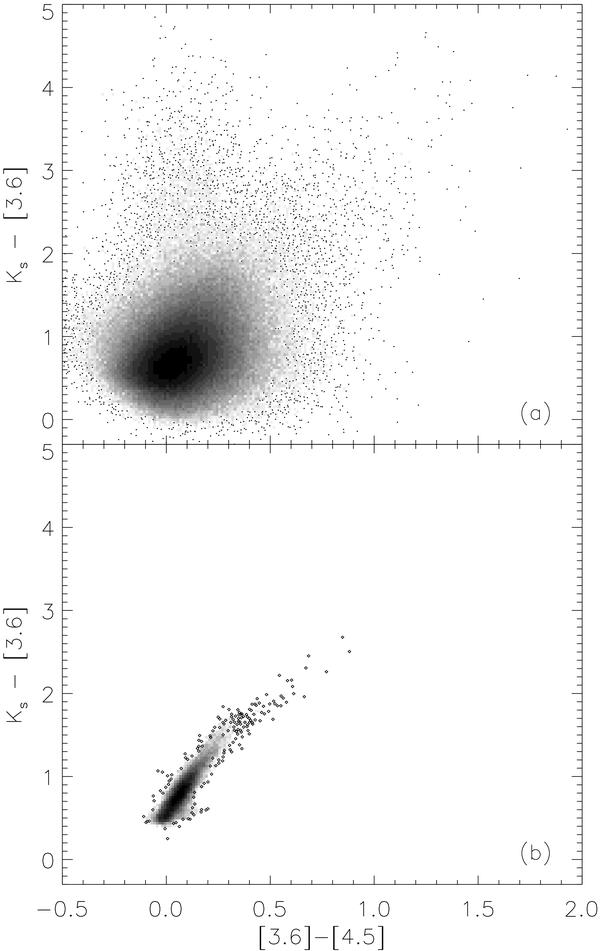
a) Color − color diagram for stars with uncertainty smaller than 0.15 mag in the 3 bands. b) Color − color diagram obtained using color maps instead of the source list. The exact same stars are used for both plots. The gray scale represents the density of the data points in the plot and the dots show the individual data points at low density.
Current usage metrics show cumulative count of Article Views (full-text article views including HTML views, PDF and ePub downloads, according to the available data) and Abstracts Views on Vision4Press platform.
Data correspond to usage on the plateform after 2015. The current usage metrics is available 48-96 hours after online publication and is updated daily on week days.
Initial download of the metrics may take a while.