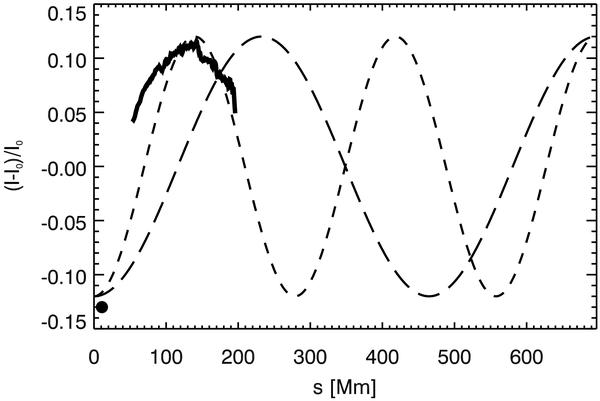
Fig. 6

Relative profile of intensity variations seen in a transversely oscillating loop studied by Verwichte et al. (2010) using TRACE as a function of distance along the loop. The solid circle is the measurement of the intensity variation at the loop foot point. The long-dashed and dashed curves are functions –0.13sin(3π/L) and –0.13sin(5π/L), respectively, representing a possible third or fifth standing harmonic of the slow mode.
Current usage metrics show cumulative count of Article Views (full-text article views including HTML views, PDF and ePub downloads, according to the available data) and Abstracts Views on Vision4Press platform.
Data correspond to usage on the plateform after 2015. The current usage metrics is available 48-96 hours after online publication and is updated daily on week days.
Initial download of the metrics may take a while.


