Fig. 3
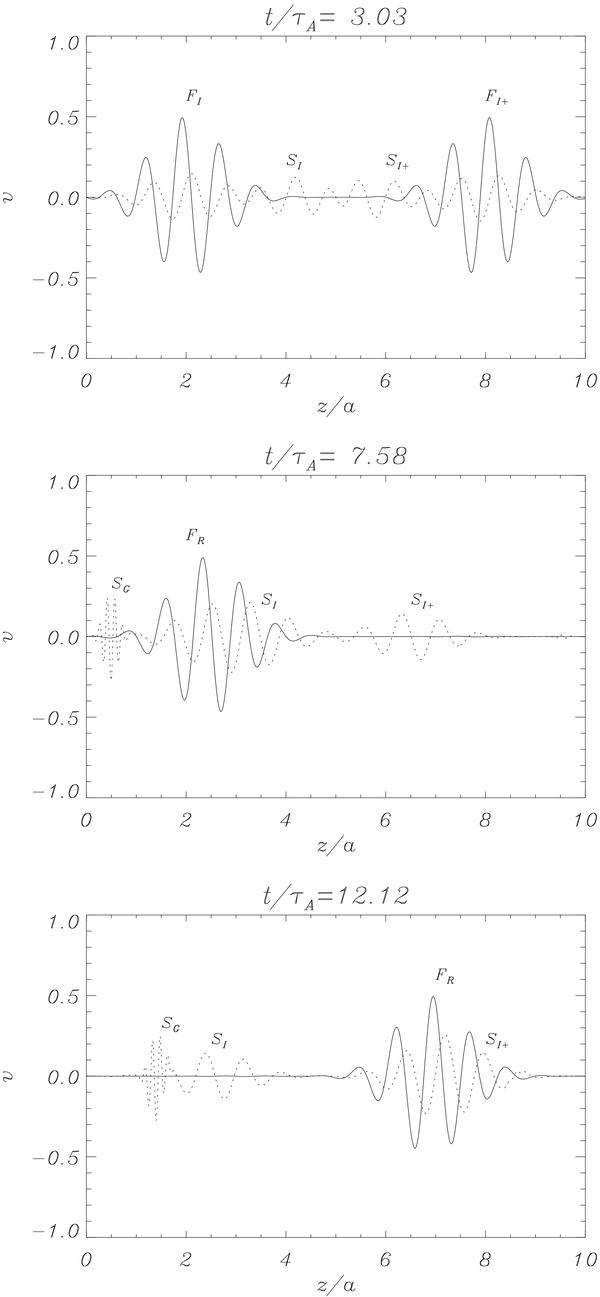
Time evolution of the propagating disturbance given by Eqs. (23)–(24). The continuous line represents the vx component, while the vz component is plotted with a dotted line. Its amplitude has been multiplied by a factor 40 for visualisation purposes. Fast and slow modes travelling to the left are denoted as FI and SI, FI + and SI + move to the right, and SG is the generated wave at z = 0 (moving to the right). For this simulation z0/a = 5, ka = 2π/0.75, v0/vA = 1, kxa = 1.5 and cs/vA = 0.2. In this plot the time has been normalised to the characteristic time scale, τA = vA/a.
Current usage metrics show cumulative count of Article Views (full-text article views including HTML views, PDF and ePub downloads, according to the available data) and Abstracts Views on Vision4Press platform.
Data correspond to usage on the plateform after 2015. The current usage metrics is available 48-96 hours after online publication and is updated daily on week days.
Initial download of the metrics may take a while.