Fig. 9
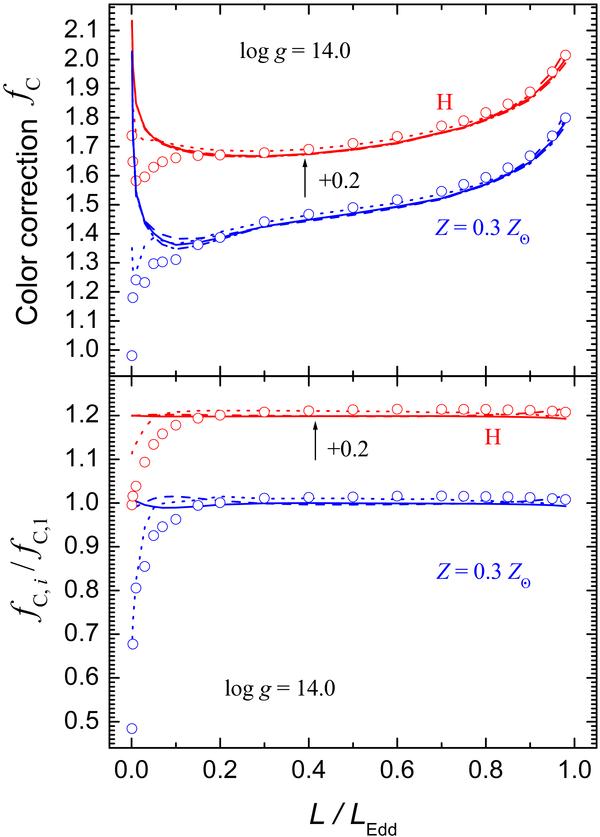
Top panel: dependence of the color correction factors on the relative luminosity for the low surface gravity (log g = 14.0) calculated by the five fitting procedures. The results obtained with the first procedure are shown by the solid curve, the second procedure – by the dashed curve, the third – by the dot-dashed curve, the fourth – by the dotted curve, and the fifth – by circles. The lower curves are for the solar mixture of hydrogen and helium and Z = 0.3 Z⊙. The upper curves correspond to pure hydrogen models and are shifted up by +0.2. Bottom panel: ratio of the color correction factors obtained using the second (dashed curve), third (solid curve), fourth (dotted), and fifth (circles) procedures to the color correction factor from the first procedure. The curves corresponding to hydrogen models are shifted up by +0.2.
Current usage metrics show cumulative count of Article Views (full-text article views including HTML views, PDF and ePub downloads, according to the available data) and Abstracts Views on Vision4Press platform.
Data correspond to usage on the plateform after 2015. The current usage metrics is available 48-96 hours after online publication and is updated daily on week days.
Initial download of the metrics may take a while.