Fig. 8
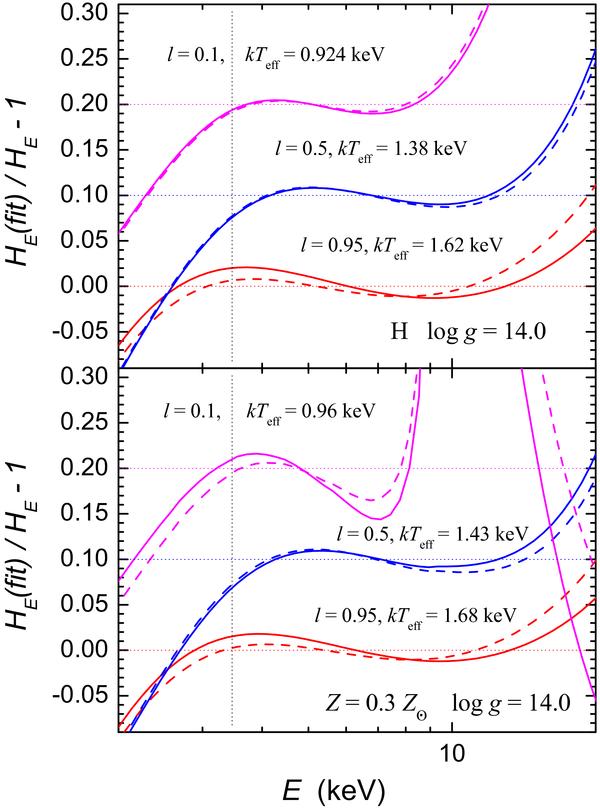
Relative errors of the computed spectra fitted by the first (solid curves) and the second (dashed curves) fit procedures vs. photon energy for hydrogen (top panel) and solar H/He mixture with Z = 0.3 Z⊙ (bottom panel) low gravity (log g = 14.0) models. Corresponding relative luminosities and effective temperatures are given at the curves. The vertical dotted line shows the low boundary of the energy band where fitting procedures were performed. For clarity, models with l = 0.5 and 0.1 were shifted by +0.1 and +0.2, respectively.
Current usage metrics show cumulative count of Article Views (full-text article views including HTML views, PDF and ePub downloads, according to the available data) and Abstracts Views on Vision4Press platform.
Data correspond to usage on the plateform after 2015. The current usage metrics is available 48-96 hours after online publication and is updated daily on week days.
Initial download of the metrics may take a while.