Fig. 7
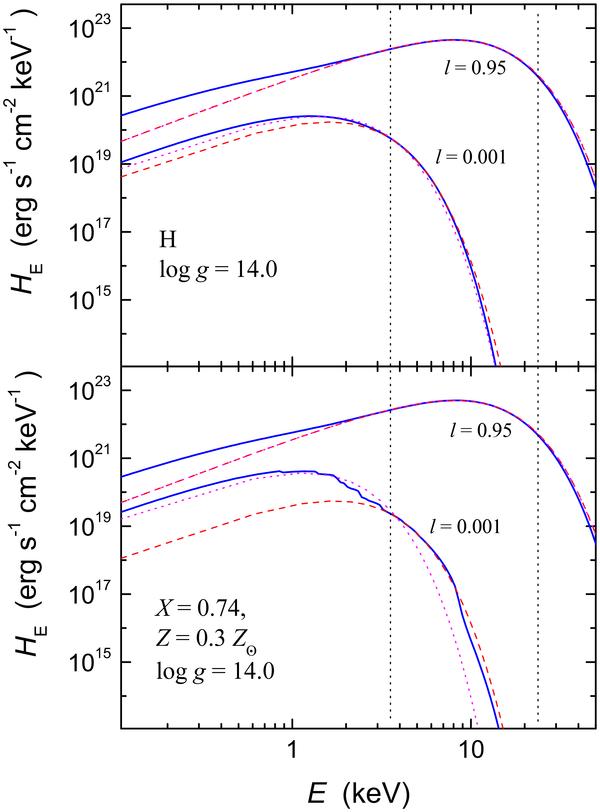
Examples NS atmosphere spectra for high (l = 0.95) and low (l = 0.001) luminosity and low gravity (log g = 14.0). Theoretical model spectra are shown by the solid curves. The diluted blackbody fits with the first fit procedure are shown by the dashed curves and the one-parameter fits (fourth fit procedure) are shown by the dotted curves. The vertical dotted lines show boundaries of the energy band where the fitting procedure was performed. Top panel is for hydrogen atmosphere and the bottom panel is for the solar H/He mixture with Z = 0.3 Z⊙.
Current usage metrics show cumulative count of Article Views (full-text article views including HTML views, PDF and ePub downloads, according to the available data) and Abstracts Views on Vision4Press platform.
Data correspond to usage on the plateform after 2015. The current usage metrics is available 48-96 hours after online publication and is updated daily on week days.
Initial download of the metrics may take a while.