Fig. 12
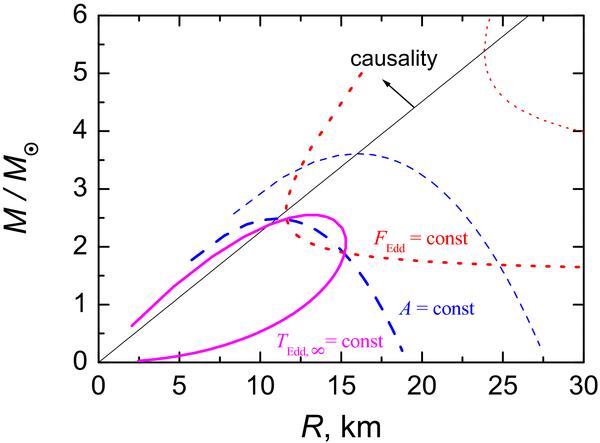
Constraints on M and R from various observables. The solid curve gives the relation obtained for the Eddington temperature TEdd,∞ = 1.64 × 10⁷ K using Eqs. (37) and (38) for pure hydrogen atmosphere (X = 1). Dotted curves are for the Eddington flux FEdd, − 7 = 0.561 (using Eq. (39)), dashed curves are for A = 0.167 (from Eq. (40)), shown for two different distances, D10 = 0.53 (thick curves) and 0.77 (thin curves). For the distance below the upper limit (41) there are solutions at the interception of the curves. If the assumed distance is too large, there are no solutions (the curves shown by thin lines do not cross).
Current usage metrics show cumulative count of Article Views (full-text article views including HTML views, PDF and ePub downloads, according to the available data) and Abstracts Views on Vision4Press platform.
Data correspond to usage on the plateform after 2015. The current usage metrics is available 48-96 hours after online publication and is updated daily on week days.
Initial download of the metrics may take a while.