Free Access
Fig. 11
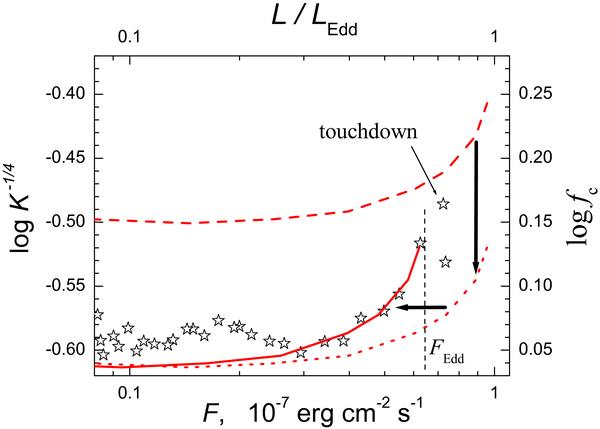
The dependence K−1/4–F as observed during the cooling track of the long burst from 4U 1724–307 on November 8, 1996 (stars). The theoretical fc–l dependence is shown by the dashed curve (right and upper axes) and the best-fit relation (solid curve).
Current usage metrics show cumulative count of Article Views (full-text article views including HTML views, PDF and ePub downloads, according to the available data) and Abstracts Views on Vision4Press platform.
Data correspond to usage on the plateform after 2015. The current usage metrics is available 48-96 hours after online publication and is updated daily on week days.
Initial download of the metrics may take a while.